Last official estimated population of Horry County was 270,561 (year 2014)[1]. This was 0.085% of total US population and 5.5% of total South Carolina state population. Area of Horry County is 1,255.0 mi² (=3250.4 km²), in this year population density was 215.59 p/mi². If population growth rate would be same as in period 2010-2014 (+0.12%/yr), Horry County population in 2026 would be 274,407 [0].
Historical population of Horry County for period 1810-2014 [1] , [2] , [3]:
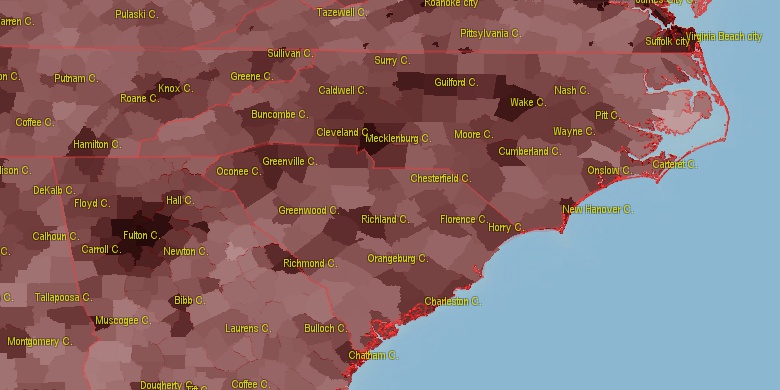
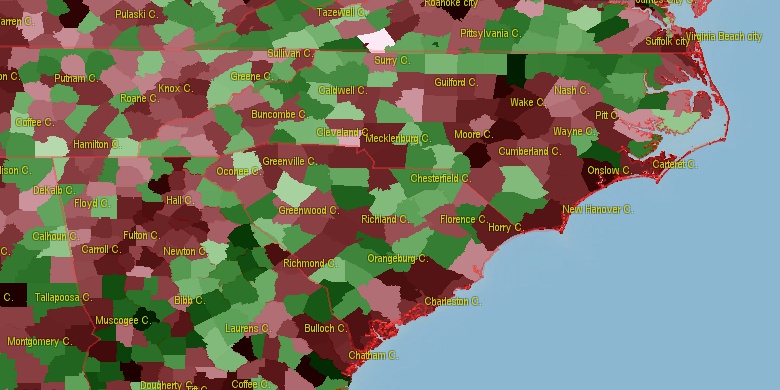
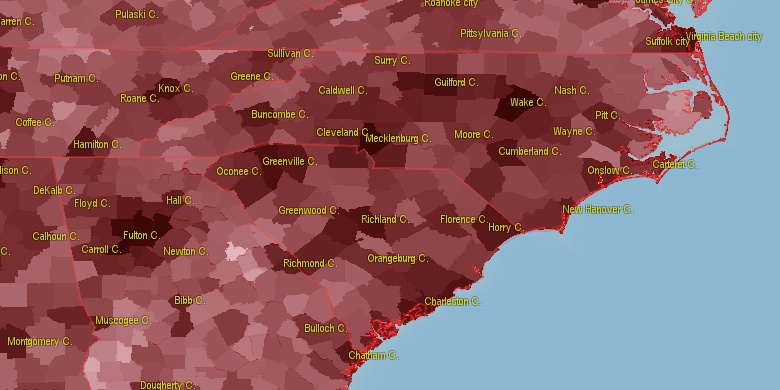
Estimated population for 2014[1]. Population density is in p./sq.mi [4]. Changes are for period 2010-2015. Value is %/year. Boundary lines are approx. 2012 [5]. Click on flag to hide it.
Population • Density • Changes • Legends • Position

[1810-1820] +1.46 %/yr
[1820-1830] +0.43 %/yr
[1830-1840] +0.93 %/yr
[1840-1850] +2.88 %/yr
[1850-1860] +0.41 %/yr
[1860-1870] +3.02 %/yr
[1870-1880] +3.8 %/yr
[1880-1890] +2.14 %/yr
[1890-1900] +1.95 %/yr
[1900-1910] +1.46 %/yr
[1910-1920] +1.74 %/yr
[1920-1930] +2.07 %/yr
[1930-1940] +2.81 %/yr
[1940-1950] +1.42 %/yr
[1950-1960] +1.33 %/yr
[1960-1970] +0.25 %/yr
[1970-1980] +3.78 %/yr
[1980-1990] +3.57 %/yr
[1990-2000] +3.16 %/yr
[2000-2005] +3.18 %/yr
[2005-2010] +3.21 %/yr
[2010-2014] +0.12 %/yr
Looking for settlements in Horry County? Visit this page: Settlements in Horry County, SC
Population of Horry County by age groups male (M) and female (F)[1b]
| Age Gr. | (M) | (F) | Total |
| 0 to 4 | 7896 | 7635 | 15,531 |
| 5 to 9 | 8256 | 8059 | 16,315 |
| 10 to 14 | 8268 | 7979 | 16,247 |
| 15 to 19 | 8186 | 7857 | 16,043 |
| 20 to 24 | 9020 | 9183 | 18,203 |
| 25 to 29 | 9616 | 9661 | 19,277 |
| 30 to 34 | 8734 | 8849 | 17,583 |
| 35 to 39 | 8552 | 8541 | 17,093 |
| 40 to 44 | 8758 | 9216 | 17,974 |
| 45 to 49 | 8887 | 9439 | 18,326 |
| 50 to 54 | 9756 | 10939 | 20,695 |
| 55 to 59 | 9619 | 11477 | 21,096 |
| 60 to 64 | 10518 | 12624 | 23,142 |
| 65 to 69 | 11257 | 12153 | 23,410 |
| 70 to 74 | 7887 | 8449 | 16,336 |
| 75 to 79 | 5063 | 5350 | 10,413 |
| 80 to 84 | 2758 | 3389 | 6,147 |
| 85+ | 1853 | 3148 | 5,001 |
Horry County resident population estimates by Sex, Race, and Hispanic Origin[1b]. For full list of abbrevations see: population.us/about page.
| Race | Male | Female | Total |
| NH | 134946 | 145576 | 280,522 |
| WAC | 122499 | 128932 | 251,431 |
| WA | 119954 | 126282 | 246,236 |
| NHWAC | 113677 | 121569 | 235,246 |
| NHWA | 111395 | 119158 | 230,553 |
| BAC | 20894 | 23296 | 44,190 |
| NHBAC | 20188 | 22597 | 42,785 |
| BA | 19351 | 21611 | 40,962 |
| NHBA | 18801 | 21060 | 39,861 |
| H | 9938 | 8372 | 18,310 |
| HWAC | 8822 | 7363 | 16,185 |
| HWA | 8559 | 7124 | 15,683 |
| TOM | 2794 | 2935 | 5,729 |
| NHTOM | 2498 | 2661 | 5,159 |
| AAC | 2267 | 2707 | 4,974 |
| NHAAC | 2099 | 2564 | 4,663 |
| IAC | 1865 | 1865 | 3,730 |
| AA | 1603 | 2034 | 3,637 |
| NHAA | 1501 | 1950 | 3,451 |
| NHIAC | 1396 | 1476 | 2,872 |
| IA | 919 | 881 | 1,800 |
| HBAC | 706 | 699 | 1,405 |
| NHIA | 582 | 613 | 1,195 |
| HBA | 550 | 551 | 1,101 |
| HIAC | 469 | 389 | 858 |
| NAC | 363 | 305 | 668 |
| HIA | 337 | 268 | 605 |
| HTOM | 296 | 274 | 570 |
| NA | 263 | 205 | 468 |
| NHNAC | 249 | 219 | 468 |
| HAAC | 168 | 143 | 311 |
| NHNA | 169 | 134 | 303 |
| HNAC | 114 | 86 | 200 |
| HAA | 102 | 84 | 186 |
| HNA | 94 | 71 | 165 |
• Florence County population
42.8 mi,  281°
281°
• Robeson County
50.9 mi,  351°
351°
• Brunswick County
43.8 mi,  78°
78°
• Georgetown County
38.6 mi,  208°
208°
• Columbus County
31.1 mi,  38°
38°
• Bladen County
53.4 mi,  27°
27°
• Williamsburg County
46.8 mi,  245°
245°
• Marion County
24.7 mi,  299°
299°
• Dillon County
40.3 mi,  325°
325°
• Marlboro County
62.4 mi,  320°
320°
[0] Calculated by population.us from last known population growth rate, not official data.
[1] County population - 2014, archived from the original, retrieved 02/23/2016
[1b] Annual County Resident Population Estimates by Age, Sex, Race, and Hispanic Origin, (used only data for 2014) archived from the original, retrieved 02/23/2016
[2] County population - 2000-2010, archived from the original, retrieved 02/23/2016
[3] Population of States and Counties of the United States: 1790 to 1992, PDF, 15 Mb, census.gov, retrieved 02/23/2016
[4] County area, latitude longitude data, retrieved 02/23/2016
[5] County boundaries, CSV files on boundaries.us, retrived 03/18/2016
*Georgetown South Carolina Notes
Page generated in 0.007 seconds© 2016 population.us | Terms of use | Contact