Last official estimated population of Dillon County was 32,087 (year 2014)[1]. This was 0.01% of total US population and 0.7% of total South Carolina state population. Area of Dillon County is 406.6 mi² (=1053.1 km²), in this year population density was 78.92 p/mi². If population growth rate would be same as in period 2010-2014 (+0.02%/yr), Dillon County population in 2026 would be 32,162 [0].
Historical population of Dillon County for period 1910-2014 [1] , [2] , [3]:
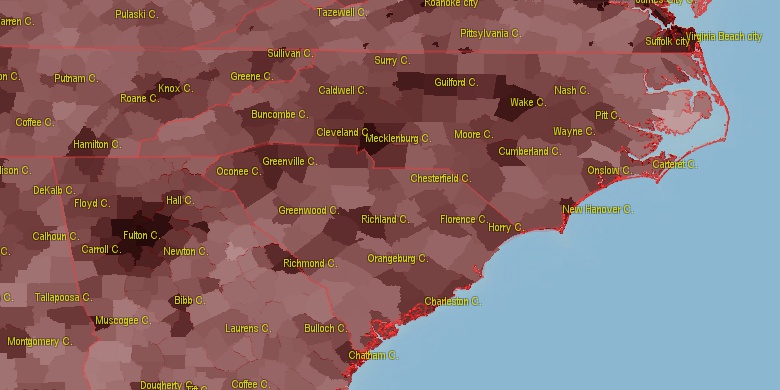
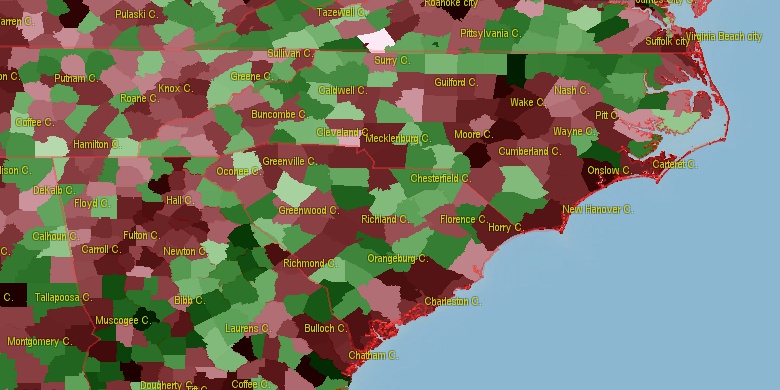
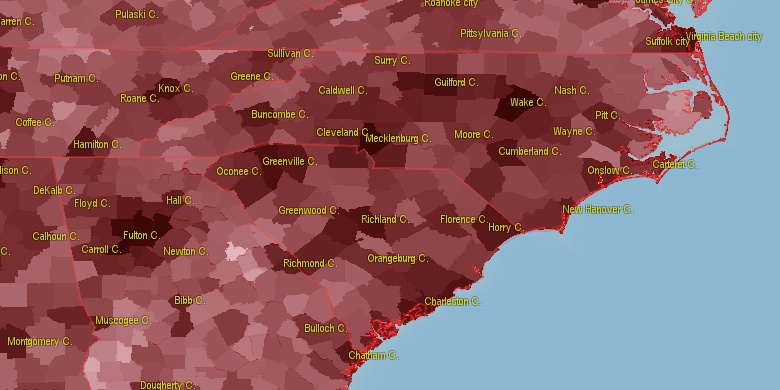
Estimated population for 2014[1]. Population density is in p./sq.mi [4]. Changes are for period 2010-2015. Value is %/year. Boundary lines are approx. 2012 [5]. Click on flag to hide it.
Population • Density • Changes • Legends • Position

[1910-1920] +1.12 %/yr
[1920-1930] +0.18 %/yr
[1930-1940] +1.42 %/yr
[1940-1950] +0.43 %/yr
[1950-1960] -0.11 %/yr
[1960-1970] -0.59 %/yr
[1970-1980] +0.75 %/yr
[1980-1990] -0.65 %/yr
[1990-2000] +0.54 %/yr
[2000-2005] +0.33 %/yr
[2005-2010] +0.52 %/yr
[2010-2014] +0.02 %/yr
Looking for settlements in Dillon County? Visit this page: Settlements in Dillon County, SC
Population of Dillon County by age groups male (M) and female (F)[1b]
| Age Gr. | (M) | (F) | Total |
| 0 to 4 | 1102 | 1105 | 2,207 |
| 5 to 9 | 1199 | 1115 | 2,314 |
| 10 to 14 | 1081 | 1121 | 2,202 |
| 15 to 19 | 985 | 1011 | 1,996 |
| 20 to 24 | 1047 | 1065 | 2,112 |
| 25 to 29 | 912 | 939 | 1,851 |
| 30 to 34 | 856 | 979 | 1,835 |
| 35 to 39 | 922 | 972 | 1,894 |
| 40 to 44 | 833 | 957 | 1,790 |
| 45 to 49 | 921 | 1021 | 1,942 |
| 50 to 54 | 978 | 1185 | 2,163 |
| 55 to 59 | 1022 | 1162 | 2,184 |
| 60 to 64 | 926 | 1033 | 1,959 |
| 65 to 69 | 736 | 907 | 1,643 |
| 70 to 74 | 506 | 663 | 1,169 |
| 75 to 79 | 354 | 442 | 796 |
| 80 to 84 | 170 | 342 | 512 |
| 85+ | 159 | 399 | 558 |
Dillon County resident population estimates by Sex, Race, and Hispanic Origin[1b]. For full list of abbrevations see: population.us/about page.
| Race | Male | Female | Total |
| NH | 14306 | 16045 | 30,351 |
| WAC | 7508 | 8080 | 15,588 |
| WA | 7245 | 7822 | 15,067 |
| NHWAC | 7231 | 7835 | 15,066 |
| BAC | 6871 | 7997 | 14,868 |
| NHBAC | 6798 | 7918 | 14,716 |
| NHWA | 6982 | 7595 | 14,577 |
| BA | 6692 | 7809 | 14,501 |
| NHBA | 6627 | 7742 | 14,369 |
| IAC | 528 | 554 | 1,082 |
| NHIAC | 465 | 490 | 955 |
| IA | 422 | 453 | 875 |
| H | 403 | 373 | 776 |
| NHIA | 365 | 395 | 760 |
| TOM | 296 | 290 | 586 |
| NHTOM | 281 | 271 | 552 |
| HWAC | 277 | 245 | 522 |
| HWA | 263 | 227 | 490 |
| AAC | 86 | 71 | 157 |
| HBAC | 73 | 79 | 152 |
| NHAAC | 81 | 67 | 148 |
| HBA | 65 | 67 | 132 |
| HIAC | 63 | 64 | 127 |
| HIA | 57 | 58 | 115 |
| AA | 48 | 41 | 89 |
| NHAA | 45 | 39 | 84 |
| NAC | 20 | 14 | 34 |
| NHNAC | 20 | 14 | 34 |
| HTOM | 15 | 19 | 34 |
| NHNA | 6 | 3 | 9 |
| NA | 6 | 3 | 9 |
| HAAC | 5 | 4 | 9 |
| HAA | 3 | 2 | 5 |
| HNAC | 0 | 0 | 0 |
| HNA | 0 | 0 | 0 |
• Horry County population
40.3 mi,  145°
145°
• Florence County
31.5 mi,  217°
217°
• Robeson County
23.2 mi,  42°
42°
• Darlington County
33.7 mi,  263°
263°
• Columbus County
42.9 mi,  101°
101°
• Hoke County
44 mi,  9°
9°
• Richmond County
47.6 mi,  333°
333°
• Scotland County
31.6 mi,  349°
349°
• Marion County
21.2 mi,  176°
176°
• Marlboro County
22.6 mi,  310°
310°
[0] Calculated by population.us from last known population growth rate, not official data.
[1] County population - 2014, archived from the original, retrieved 02/23/2016
[1b] Annual County Resident Population Estimates by Age, Sex, Race, and Hispanic Origin, (used only data for 2014) archived from the original, retrieved 02/23/2016
[2] County population - 2000-2010, archived from the original, retrieved 02/23/2016
[3] Population of States and Counties of the United States: 1790 to 1992, PDF, 15 Mb, census.gov, retrieved 02/23/2016
[4] County area, latitude longitude data, retrieved 02/23/2016
[5] County boundaries, CSV files on boundaries.us, retrived 03/18/2016
*Marion South Carolina Notes
Page generated in 0.016 seconds© 2016 population.us | Terms of use | Contact