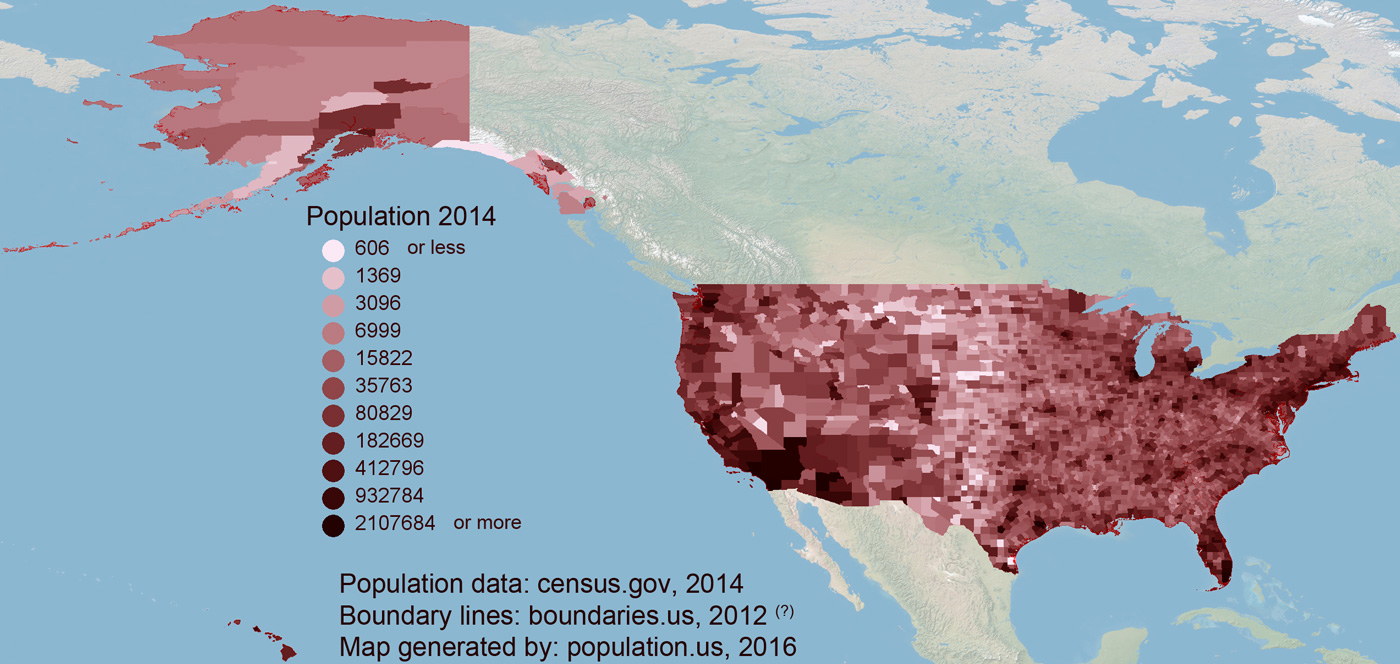
Population statistics and maps (population, density and changes) for every county in the US. Most populated counties are Los Angeles County, California, Cook County, Ilinois and Harris County, Texas. County with largest population density is New York County with more than 47000 p./sq.mi (if density for this county would be same as for Alaska, then population of NY county would be only 37 people). Population rate changes for period 2010-2014 is very variable value, that can be seen on third map below. Approximately 44% of counties have negative- and 56% have positive population rate. You can find county using search field or start by clicking on the first letter of the name or choose the state.
If you find the county, it will be marked on enlarged map. You may find useful our US map with county names (GIF 9742x4278, 1.2 Mb). Alaska map with county names is on separated file.
Estimated population for 2014[1]. Population density is in p./sq.mi [2]. Changes are for period 2010-2015. Value is %/year. Boundary lines are apx. 2012 [3].
Population • Density • Changes
A B C D E F G H I J K L M N O P Q R S T U V W Y Z
Or you can search county by state..
Alabama Alaska Arizona Arkansas California Colorado Connecticut Delaware District of Columbia Florida Georgia Hawaii Idaho Illinois Indiana Iowa Kansas Kentucky Louisiana Maine Maryland Massachusetts Michigan Minnesota Mississippi Missouri Montana Nebraska Nevada New Hampshire New Jersey New Mexico New York North Carolina North Dakota Ohio Oklahoma Oregon Pennsylvania Rhode Island South Carolina South Dakota Tennessee Texas Utah Vermont Virginia Washington West Virginia Wisconsin Wyoming
[1] County population - 2014, archived from the original, retrieved 02/23/2016
[2] County area, latitude longitude data, retrieved 02/23/2016
[3] County boundaries, CSV files on boundaries.us, retrived 03/18/2016
© 2016 population.us | Terms of use | Contact

