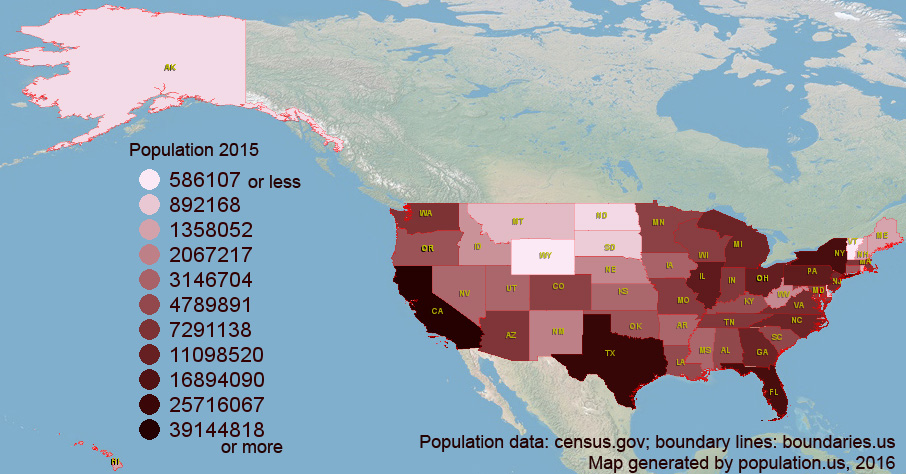
Population statistics and maps (population, density and changes) for every state in the US. Most populated states are California, Texas and Florida; together these three states have population of almost 90 millions. States with largest population density are: District of Columbia (due large population and small area, with almost 10,000 p/mi2) and New Jersey (with approximately 1000 p/mi2). State with largest population changes (interval 2010-2015) is North Dakota, and the only state where population was reducing (for this period) is West Virginia. Below maps is a list with all states (or you can use search field).
Estimated population for 2015[1]. Population density is in p./sq.mi [2]. Changes are for period 2010-2015. Value is %/year. Boundary lines are approximatelly 2012 [3].
Population • Density • Changes
Population density is in [p/mi²], changes are for period 2010-2015 in %/year. Click on state name to get more details, historical population and position on map.
| state | population 2015 |
density p/mi² |
changes %/yr |
|---|---|---|---|
| Alabama | 4858979 | 92.7 | 0.329 |
| Alaska | 738432 | 1.1 | 0.782 |
| Arizona | 6828065 | 59.9 | 1.329 |
| Arkansas | 2978204 | 56 | 0.424 |
| California | 39144818 | 239.1 | 0.995 |
| Colorado | 5456574 | 52.4 | 1.645 |
| Connecticut | 3590886 | 647.8 | 0.094 |
| Delaware | 945934 | 380.1 | 1.047 |
| District of Columbia | 672228 | 9836.5 | 2.241 |
| Florida | 20271272 | 308.3 | 1.517 |
| Georgia | 10214860 | 171.9 | 1.065 |
| Hawaii | 1431603 | 131 | 1.027 |
| Idaho | 1654930 | 19.8 | 1.09 |
| Illinois | 12859995 | 222.1 | 0.046 |
| Indiana | 6619680 | 181.8 | 0.416 |
| Iowa | 3123899 | 55.5 | 0.504 |
| Kansas | 2911641 | 35.4 | 0.407 |
| Kentucky | 4425092 | 109.5 | 0.392 |
| Louisiana | 4670724 | 89.2 | 0.599 |
| Maine | 1329328 | 37.6 | 0.015 |
| Maryland | 6006401 | 484.2 | 0.794 |
| Massachusetts | 6794422 | 643.8 | 0.743 |
| Michigan | 9922576 | 102.6 | 0.079 |
| Minnesota | 5489594 | 63.1 | 0.691 |
| Mississippi | 2992333 | 61.8 | 0.168 |
| Missouri | 6083672 | 87.3 | 0.314 |
| state | population 2015 |
density p/mi² |
changes %/yr |
|---|---|---|---|
| Montana | 1032949 | 7 | 0.865 |
| Nebraska | 1896190 | 24.5 | 0.753 |
| Nevada | 2890845 | 26.1 | 1.371 |
| New Hampshire | 1330608 | 142.3 | 0.214 |
| New Jersey | 8958013 | 1027 | 0.375 |
| New Mexico | 2085109 | 17.1 | 0.251 |
| New York | 19795791 | 362.9 | 0.427 |
| North Carolina | 10042802 | 186.6 | 1.042 |
| North Dakota | 756927 | 10.7 | 2.391 |
| Ohio | 11613423 | 259.1 | 0.133 |
| Oklahoma | 3911338 | 56 | 0.839 |
| Oregon | 4028977 | 41 | 1.012 |
| Pennsylvania | 12802503 | 278 | 0.157 |
| Rhode Island | 1056298 | 683.7 | 0.071 |
| South Carolina | 4896146 | 152.9 | 1.144 |
| South Dakota | 858469 | 11.1 | 1.065 |
| Tennessee | 6600299 | 156.6 | 0.789 |
| Texas | 27469114 | 102.3 | 1.783 |
| Utah | 2995919 | 35.3 | 1.625 |
| Vermont | 626042 | 65.1 | 0.01 |
| Virginia | 8382993 | 196 | 0.937 |
| Washington | 7170351 | 100.6 | 1.292 |
| West Virginia | 1844128 | 76.1 | -0.096 |
| Wisconsin | 5771337 | 88.1 | 0.295 |
| Wyoming | 586107 | 6 | 0.785 |
[1] State population - 2015, census.gov, Archived from the original, retrieved 02/23/2016
[2] United States Summary: 2010, Population and Housing Unit Counts, 2010 Census of Population and Housing, State areas, PDF 35 Mb, September 2012. pp. V–2, 1 & 41 (Tables 1 & 18). Retrieved February 24, 2016.
[3] State boundaries, CSV files on boundaries.us, retrived 03/18/2016
© 2016 population.us | Terms of use | Contact

