Last official estimated population of Oregon was 4,028,977 (year 2015)[1]. This was 1.3% of total US population. Area of Oregon is 98,378.5 mi² (=254799.4 km²), in this year population density was 40.95 p/mi². If population growth rate would be same as in period 2010-2015 (+1.01%/yr), Oregon population in 2026 would be 4,501,095*.
Historical population of Oregon state for period 1850-2015 [1] , [2] , [3]:
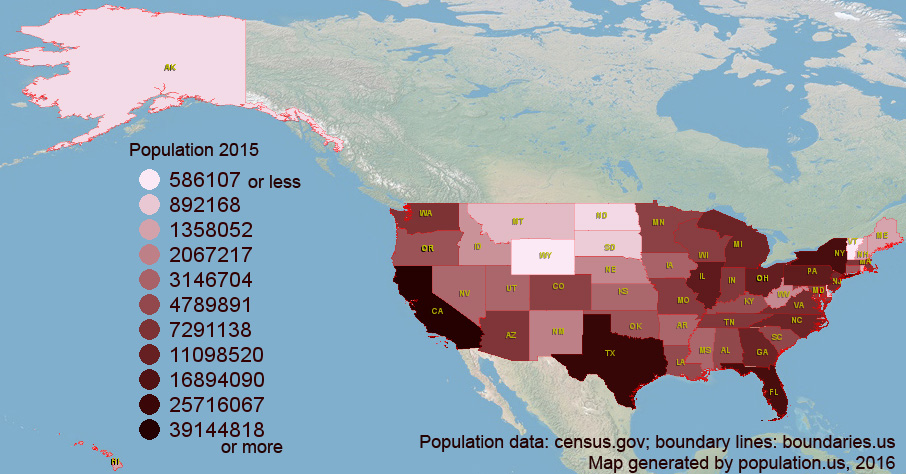
Estimated population for 2015[1]. Population density is in p./sq.mi [4]. Changes are for period 2010-2015. Value is %/year. Boundary lines are apx. 2012 [5]. Click on flag to hide it.
Population • Density • Changes

Enter your birthday, to find out
[1850-1860] +15.81 %/yr
[1860-1870] +5.65 %/yr
[1870-1880] +6.75 %/yr
[1880-1890] +6.16 %/yr
[1890-1900] +2.67 %/yr
[1900-1910] +4.99 %/yr
[1910-1920] +1.53 %/yr
[1920-1930] +1.99 %/yr
[1930-1940] +1.34 %/yr
[1940-1950] +3.39 %/yr
[1950-1960] +1.52 %/yr
[1960-1970] +1.69 %/yr
[1970-1980] +2.33 %/yr
[1980-1990] +0.77 %/yr
[1990-2000] +1.87 %/yr
[2000-2010] +1.14 %/yr
[2010-2015] +1.01 %/yr
Or click: Counties in Oregon
Portland City
Salem City
Eugene City
Gresham City
Hillsboro City
Multnomah County
Washington County
Clackamas County
Lane County
Marion County
*Calculated by population.us from last known population growth rate, not official data.***
[1] State population - 2015, Archived from the original, retrieved 02/23/2016
[2] State population 2000-2010, Archived form the original, retrieved 02/23/2016
[3] Population of States and Counties of the United States: 1790 to 1991, PDF, 15 Mb, census.gov, retrieved 02/23/2016
[4] United States Summary: 2010, Population and Housing Unit Counts, 2010 Census of Population and Housing, State areas, PDF 35 Mb, September 2012. pp. V–2, 1 & 41 (Tables 1 & 18). Retrieved February 24, 2016.
[5] Oregon boundaries, CSV file, retrived 03/18/2016
© 2016 population.us | Terms of use | Contact

