Last official estimated population of Marlboro County was 28,907 (year 2014)[1]. This was 0.009% of total US population and 0.6% of total South Carolina state population. Area of Marlboro County is 485.3 mi² (=1256.9 km²), in this year population density was 59.57 p/mi². If population growth rate would be same as in period 2010-2014 (-0.02%/yr), Marlboro County population in 2026 would be 28,829 [0].
Historical population of Marlboro County for period 1790-2014 [1] , [2] , [3]:
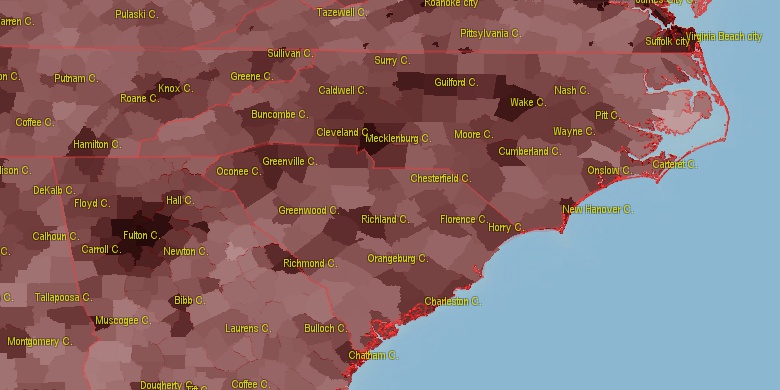
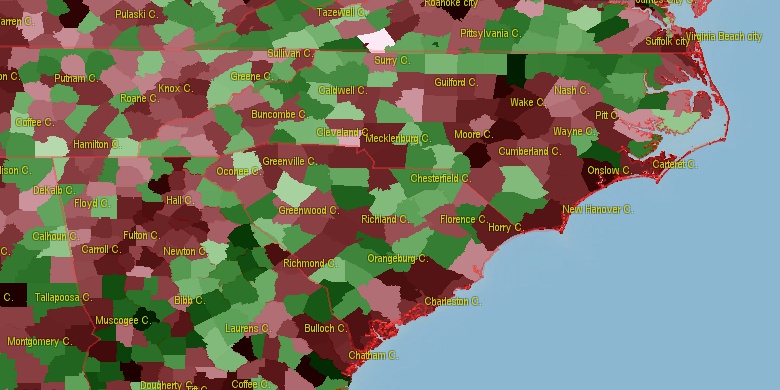
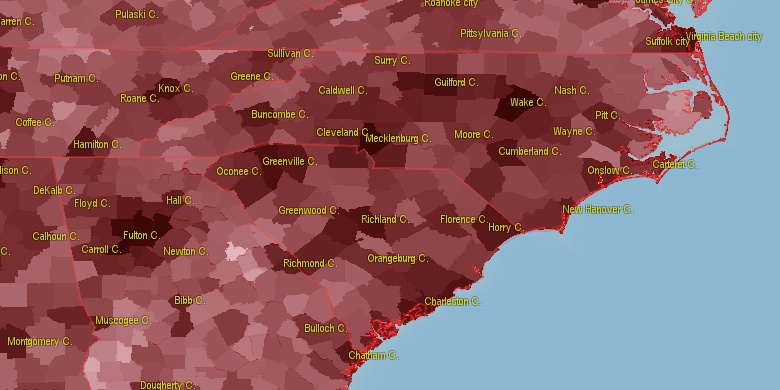
Estimated population for 2014[1]. Population density is in p./sq.mi [4]. Changes are for period 2010-2015. Value is %/year. Boundary lines are approx. 2012 [5]. Click on flag to hide it.
Population • Density • Changes • Legends • Position

[1790-1800] -6.53 %/yr
[1800-1810] -0.93 %/yr
[1810-1820] +2.61 %/yr
[1820-1830] +2.94 %/yr
[1830-1840] -0.2 %/yr
[1840-1850] +2.52 %/yr
[1850-1860] +1.43 %/yr
[1860-1870] -0.51 %/yr
[1870-1880] +5.72 %/yr
[1880-1890] +1.33 %/yr
[1890-1900] +1.64 %/yr
[1900-1910] +1.22 %/yr
[1910-1920] +0.62 %/yr
[1920-1930] -0.48 %/yr
[1930-1940] +0.51 %/yr
[1940-1950] -0.46 %/yr
[1950-1960] -1.07 %/yr
[1960-1970] -0.49 %/yr
[1970-1980] +1.54 %/yr
[1980-1990] -0.62 %/yr
[1990-2000] -0.31 %/yr
[2000-2005] -0.63 %/yr
[2005-2010] +0.72 %/yr
[2010-2014] -0.02 %/yr
Looking for settlements in Marlboro County? Visit this page: Settlements in Marlboro County, SC
Population of Marlboro County by age groups male (M) and female (F)[1b]
| Age Gr. | (M) | (F) | Total |
| 0 to 4 | 761 | 737 | 1,498 |
| 5 to 9 | 797 | 836 | 1,633 |
| 10 to 14 | 838 | 755 | 1,593 |
| 15 to 19 | 845 | 758 | 1,603 |
| 20 to 24 | 1074 | 778 | 1,852 |
| 25 to 29 | 1270 | 725 | 1,995 |
| 30 to 34 | 1321 | 711 | 2,032 |
| 35 to 39 | 1192 | 777 | 1,969 |
| 40 to 44 | 1071 | 791 | 1,862 |
| 45 to 49 | 1031 | 892 | 1,923 |
| 50 to 54 | 1057 | 962 | 2,019 |
| 55 to 59 | 944 | 996 | 1,940 |
| 60 to 64 | 832 | 933 | 1,765 |
| 65 to 69 | 743 | 850 | 1,593 |
| 70 to 74 | 497 | 585 | 1,082 |
| 75 to 79 | 296 | 397 | 693 |
| 80 to 84 | 142 | 291 | 433 |
| 85+ | 132 | 307 | 439 |
Marlboro County resident population estimates by Sex, Race, and Hispanic Origin[1b]. For full list of abbrevations see: population.us/about page.
| Race | Male | Female | Total |
| NH | 14131 | 12913 | 27,044 |
| BAC | 7751 | 6743 | 14,494 |
| NHBAC | 7658 | 6697 | 14,355 |
| BA | 7618 | 6620 | 14,238 |
| NHBA | 7530 | 6577 | 14,107 |
| WAC | 6476 | 5737 | 12,213 |
| WA | 6243 | 5518 | 11,761 |
| NHWAC | 5919 | 5652 | 11,571 |
| NHWA | 5693 | 5440 | 11,133 |
| IAC | 775 | 753 | 1,528 |
| NHIAC | 715 | 712 | 1,427 |
| IA | 657 | 642 | 1,299 |
| NHIA | 600 | 606 | 1,206 |
| H | 712 | 168 | 880 |
| HWAC | 557 | 85 | 642 |
| HWA | 550 | 78 | 628 |
| TOM | 260 | 247 | 507 |
| NHTOM | 251 | 238 | 489 |
| AAC | 86 | 90 | 176 |
| NHAAC | 83 | 87 | 170 |
| HBAC | 93 | 46 | 139 |
| HBA | 88 | 43 | 131 |
| AA | 54 | 51 | 105 |
| NHAA | 53 | 51 | 104 |
| HIAC | 60 | 41 | 101 |
| HIA | 57 | 36 | 93 |
| NAC | 21 | 15 | 36 |
| NHNAC | 13 | 13 | 26 |
| HTOM | 9 | 9 | 18 |
| NA | 11 | 3 | 14 |
| HNAC | 8 | 2 | 10 |
| HNA | 7 | 2 | 9 |
| HAAC | 3 | 3 | 6 |
| NHNA | 4 | 1 | 5 |
| HAA | 1 | 0 | 1 |
• Florence County population
39.7 mi,  182°
182°
• Robeson County
32.9 mi,  85°
85°
• Darlington County
24.7 mi,  220°
220°
• Hoke County
37.9 mi,  40°
40°
• Chesterfield County
27.5 mi,  275°
275°
• Richmond County
28.2 mi,  350°
350°
• Scotland County
20 mi,  34°
34°
• Marion County
40.3 mi,  152°
152°
• Dillon County
22.6 mi,  130°
130°
• Anson County
35.6 mi,  316°
316°
[0] Calculated by population.us from last known population growth rate, not official data.
[1] County population - 2014, archived from the original, retrieved 02/23/2016
[1b] Annual County Resident Population Estimates by Age, Sex, Race, and Hispanic Origin, (used only data for 2014) archived from the original, retrieved 02/23/2016
[2] County population - 2000-2010, archived from the original, retrieved 02/23/2016
[3] Population of States and Counties of the United States: 1790 to 1992, PDF, 15 Mb, census.gov, retrieved 02/23/2016
[4] County area, latitude longitude data, retrieved 02/23/2016
[5] County boundaries, CSV files on boundaries.us, retrived 03/18/2016
See note 19 South Carolina Notes
Page generated in 0.017 seconds© 2016 population.us | Terms of use | Contact