Last official estimated population of Marion County was 32,958 (year 2014)[1]. This was 0.01% of total US population and 0.7% of total South Carolina state population. Area of Marion County is 494.1 mi² (=1279.8 km²), in this year population density was 66.70 p/mi². If population growth rate would be same as in period 2010-2014 (-0.08%/yr), Marion County population in 2026 would be 32,648 [0].
Historical population of Marion County for period 1800-2014 [1] , [2] , [3]:
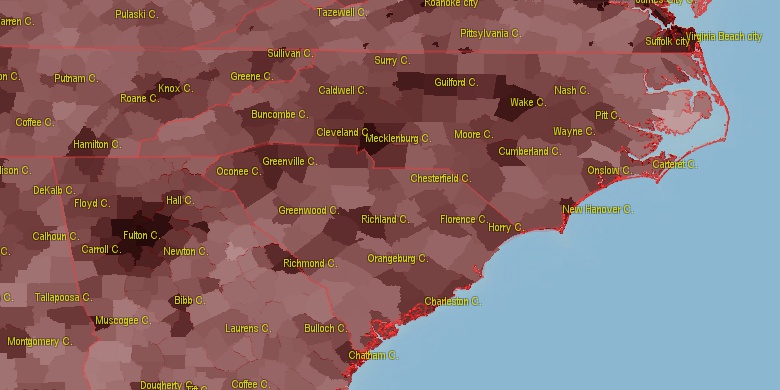
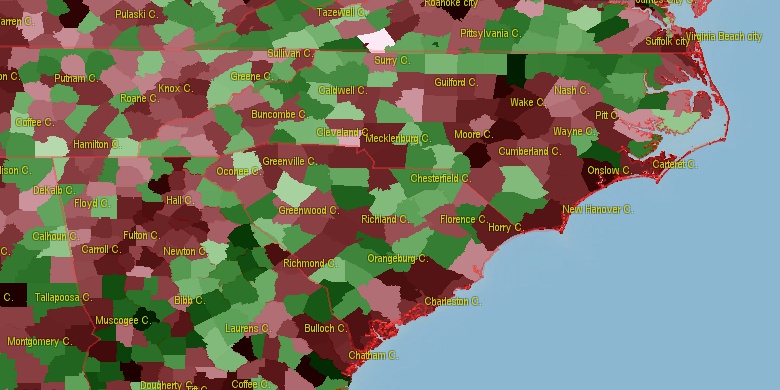
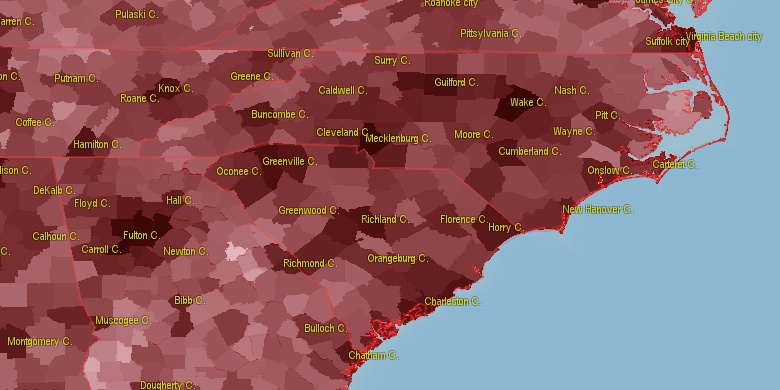
Estimated population for 2014[1]. Population density is in p./sq.mi [4]. Changes are for period 2010-2015. Value is %/year. Boundary lines are approx. 2012 [5]. Click on flag to hide it.
Population • Density • Changes • Legends • Position

[1800-1810] +2.54 %/yr
[1810-1820] +1.39 %/yr
[1820-1830] +0.95 %/yr
[1830-1840] +2.2 %/yr
[1840-1850] +2.25 %/yr
[1850-1860] +1.99 %/yr
[1860-1870] +0.45 %/yr
[1870-1880] +4.41 %/yr
[1880-1890] -1.28 %/yr
[1890-1900] +1.61 %/yr
[1900-1910] -5.21 %/yr
[1910-1920] +1.42 %/yr
[1920-1930] +1.39 %/yr
[1930-1940] +1.01 %/yr
[1940-1950] +0.96 %/yr
[1950-1960] -0.34 %/yr
[1960-1970] -0.56 %/yr
[1970-1980] +1.22 %/yr
[1980-1990] -0.08 %/yr
[1990-2000] +0.46 %/yr
[2000-2005] -0.65 %/yr
[2005-2010] -0.75 %/yr
[2010-2014] -0.08 %/yr
Looking for settlements in Marion County? Visit this page: Settlements in Marion County, SC
Population of Marion County by age groups male (M) and female (F)[1b]
| Age Gr. | (M) | (F) | Total |
| 0 to 4 | 982 | 981 | 1,963 |
| 5 to 9 | 1084 | 1064 | 2,148 |
| 10 to 14 | 1091 | 1023 | 2,114 |
| 15 to 19 | 1046 | 933 | 1,979 |
| 20 to 24 | 1052 | 1081 | 2,133 |
| 25 to 29 | 804 | 955 | 1,759 |
| 30 to 34 | 823 | 965 | 1,788 |
| 35 to 39 | 849 | 990 | 1,839 |
| 40 to 44 | 836 | 1017 | 1,853 |
| 45 to 49 | 878 | 1062 | 1,940 |
| 50 to 54 | 973 | 1163 | 2,136 |
| 55 to 59 | 1049 | 1375 | 2,424 |
| 60 to 64 | 1057 | 1350 | 2,407 |
| 65 to 69 | 904 | 1116 | 2,020 |
| 70 to 74 | 581 | 765 | 1,346 |
| 75 to 79 | 392 | 535 | 927 |
| 80 to 84 | 206 | 391 | 597 |
| 85+ | 146 | 414 | 560 |
Marion County resident population estimates by Sex, Race, and Hispanic Origin[1b]. For full list of abbrevations see: population.us/about page.
| Race | Male | Female | Total |
| NH | 14272 | 16798 | 31,070 |
| BAC | 8134 | 10147 | 18,281 |
| NHBAC | 8017 | 10044 | 18,061 |
| BA | 8021 | 10030 | 18,051 |
| NHBA | 7917 | 9935 | 17,852 |
| WAC | 6472 | 6891 | 13,363 |
| WA | 6331 | 6733 | 13,064 |
| NHWAC | 6145 | 6631 | 12,776 |
| NHWA | 6020 | 6493 | 12,513 |
| H | 481 | 382 | 863 |
| HWAC | 327 | 260 | 587 |
| HWA | 311 | 240 | 551 |
| IAC | 190 | 189 | 379 |
| TOM | 172 | 194 | 366 |
| NHTOM | 152 | 171 | 323 |
| NHIAC | 139 | 154 | 293 |
| AAC | 124 | 150 | 274 |
| NHAAC | 118 | 142 | 260 |
| IA | 127 | 112 | 239 |
| HBAC | 117 | 103 | 220 |
| AA | 97 | 111 | 208 |
| NHAA | 97 | 107 | 204 |
| HBA | 104 | 95 | 199 |
| NHIA | 84 | 92 | 176 |
| HIAC | 51 | 35 | 86 |
| HIA | 43 | 20 | 63 |
| HTOM | 20 | 23 | 43 |
| NAC | 19 | 12 | 31 |
| NHNAC | 13 | 12 | 25 |
| HAAC | 6 | 8 | 14 |
| HNAC | 6 | 0 | 6 |
| NA | 5 | 0 | 5 |
| HAA | 0 | 4 | 4 |
| HNA | 3 | 0 | 3 |
| NHNA | 2 | 0 | 2 |
• Horry County population
24.7 mi,  119°
119°
• Florence County
20.7 mi,  259°
259°
• Robeson County
41 mi,  20°
20°
• Darlington County
38.8 mi,  296°
296°
• Georgetown County
46.1 mi,  175°
175°
• Columbus County
42.7 mi,  73°
73°
• Williamsburg County
37.8 mi,  213°
213°
• Dillon County
21.2 mi,  356°
356°
• Marlboro County
40.3 mi,  332°
332°
• Lee County
51.6 mi,  275°
275°
[0] Calculated by population.us from last known population growth rate, not official data.
[1] County population - 2014, archived from the original, retrieved 02/23/2016
[1b] Annual County Resident Population Estimates by Age, Sex, Race, and Hispanic Origin, (used only data for 2014) archived from the original, retrieved 02/23/2016
[2] County population - 2000-2010, archived from the original, retrieved 02/23/2016
[3] Population of States and Counties of the United States: 1790 to 1992, PDF, 15 Mb, census.gov, retrieved 02/23/2016
[4] County area, latitude longitude data, retrieved 02/23/2016
[5] County boundaries, CSV files on boundaries.us, retrived 03/18/2016
*Georgetown South Carolina Notes
Page generated in 0.017 seconds© 2016 population.us | Terms of use | Contact