Last official estimated population of Graham County was 37,139 (year 2014)[1]. This was 0.012% of total US population and 0.5% of total Arizona state population. Area of Graham County is 4,641.0 mi² (=12020 km²), in this year population density was 8.00 p/mi². If population growth rate would be same as in period 2010-2014 (-0.05%/yr), Graham County population in 2026 would be 36,897 [0].
Historical population of Graham County for period 1890-2014 [1] , [2] , [3]:
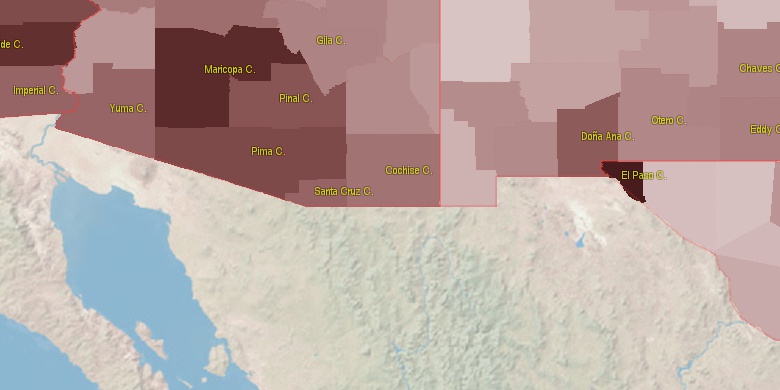
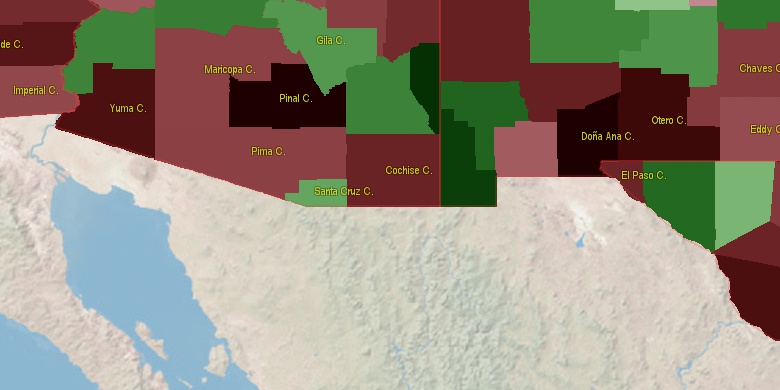
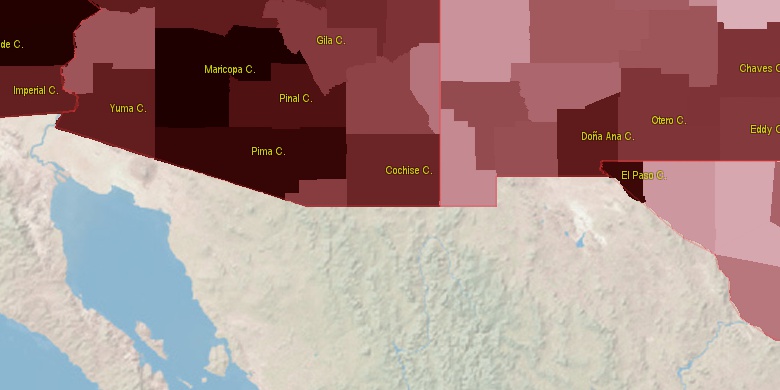
Estimated population for 2014[1]. Population density is in p./sq.mi [4]. Changes are for period 2010-2015. Value is %/year. Boundary lines are approx. 2012 [5]. Click on flag to hide it.
Population • Density • Changes • Legends • Position

[1890-1900] +9.59 %/yr
[1900-1910] +5.42 %/yr
[1910-1920] -8.25 %/yr
[1920-1930] +0.22 %/yr
[1930-1940] +1.56 %/yr
[1940-1950] +0.7 %/yr
[1950-1960] +0.79 %/yr
[1960-1970] +1.67 %/yr
[1970-1980] +3.27 %/yr
[1980-1990] +1.51 %/yr
[1990-2000] +2.34 %/yr
[2000-2005] -0.31 %/yr
[2005-2010] +2.46 %/yr
[2010-2014] -0.05 %/yr
Looking for settlements in Graham County? Visit this page: Settlements in Graham County, AZ
Population of Graham County by age groups male (M) and female (F)[1b]
| Age Gr. | (M) | (F) | Total |
| 0 to 4 | 1495 | 1432 | 2,927 |
| 5 to 9 | 1610 | 1544 | 3,154 |
| 10 to 14 | 1457 | 1468 | 2,925 |
| 15 to 19 | 1504 | 1367 | 2,871 |
| 20 to 24 | 1701 | 1373 | 3,074 |
| 25 to 29 | 1682 | 1185 | 2,867 |
| 30 to 34 | 1688 | 1062 | 2,750 |
| 35 to 39 | 1421 | 1038 | 2,459 |
| 40 to 44 | 1331 | 926 | 2,257 |
| 45 to 49 | 1220 | 873 | 2,093 |
| 50 to 54 | 1066 | 973 | 2,039 |
| 55 to 59 | 1109 | 990 | 2,099 |
| 60 to 64 | 854 | 921 | 1,775 |
| 65 to 69 | 759 | 790 | 1,549 |
| 70 to 74 | 532 | 594 | 1,126 |
| 75 to 79 | 412 | 485 | 897 |
| 80 to 84 | 253 | 375 | 628 |
| 85+ | 195 | 272 | 467 |
Graham County resident population estimates by Sex, Race, and Hispanic Origin[1b]. For full list of abbrevations see: population.us/about page.
| Race | Male | Female | Total |
| WAC | 16802 | 14590 | 31,392 |
| WA | 16496 | 14306 | 30,802 |
| NH | 13384 | 12372 | 25,756 |
| NHWAC | 10263 | 9645 | 19,908 |
| NHWA | 10064 | 9451 | 19,515 |
| H | 6905 | 5296 | 12,201 |
| HWAC | 6539 | 4945 | 11,484 |
| HWA | 6432 | 4855 | 11,287 |
| IAC | 2811 | 2858 | 5,669 |
| IA | 2633 | 2698 | 5,331 |
| NHIAC | 2480 | 2550 | 5,030 |
| NHIA | 2377 | 2450 | 4,827 |
| BAC | 718 | 307 | 1,025 |
| NHBAC | 626 | 225 | 851 |
| BA | 603 | 204 | 807 |
| NHBA | 537 | 146 | 683 |
| TOM | 365 | 315 | 680 |
| HIAC | 331 | 308 | 639 |
| HIA | 256 | 248 | 504 |
| NHTOM | 246 | 217 | 463 |
| AAC | 234 | 167 | 401 |
| NHAAC | 193 | 136 | 329 |
| AA | 150 | 105 | 255 |
| NHAA | 129 | 89 | 218 |
| HTOM | 119 | 98 | 217 |
| HBAC | 92 | 82 | 174 |
| NAC | 96 | 69 | 165 |
| HBA | 66 | 58 | 124 |
| NHNAC | 73 | 39 | 112 |
| NA | 42 | 40 | 82 |
| HAAC | 41 | 31 | 72 |
| HNAC | 23 | 30 | 53 |
| NHNA | 31 | 19 | 50 |
| HAA | 21 | 16 | 37 |
| HNA | 11 | 21 | 32 |
• Pima County population
124.1 mi,  243°
243°
• Pinal County
86.3 mi,  269°
269°
• Cochise County
75.7 mi,  175°
175°
• Gila County
80.1 mi,  317°
317°
• Santa Cruz County
112.4 mi,  210°
210°
• Grant County
88 mi,  99°
99°
• Luna County
134.4 mi,  112°
112°
• Greenlee County
42.5 mi,  60°
60°
• Hidalgo County
97 mi,  137°
137°
• Catron County
108.8 mi,  51°
51°
[0] Calculated by population.us from last known population growth rate, not official data.
[1] County population - 2014, archived from the original, retrieved 02/23/2016
[1b] Annual County Resident Population Estimates by Age, Sex, Race, and Hispanic Origin, (used only data for 2014) archived from the original, retrieved 02/23/2016
[2] County population - 2000-2010, archived from the original, retrieved 02/23/2016
[3] Population of States and Counties of the United States: 1790 to 1992, PDF, 15 Mb, census.gov, retrieved 02/23/2016
[4] County area, latitude longitude data, retrieved 02/23/2016
[5] County boundaries, CSV files on boundaries.us, retrived 03/18/2016
*Apache, Pima Arizona Notes
Page generated in 0.007 seconds© 2016 population.us | Terms of use | Contact