Last official estimated population of Hidalgo County was 4,851 (year 2014)[1]. This was 0.002% of total US population and 0.2% of total New Mexico state population. Area of Hidalgo County is 3,446.0 mi² (=8925.1 km²), in this year population density was 1.41 p/mi². If population growth rate would be same as in period 2010-2014 (-0.22%/yr), Hidalgo County population in 2026 would be 4,724 [0].
Historical population of Hidalgo County for period 1890-2014 [1] , [2] , [3]:
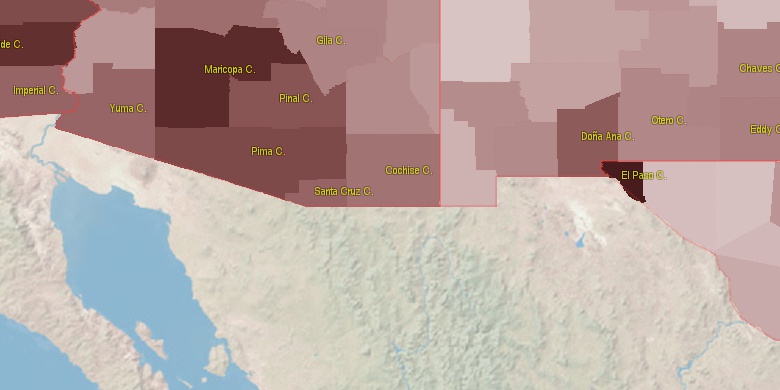
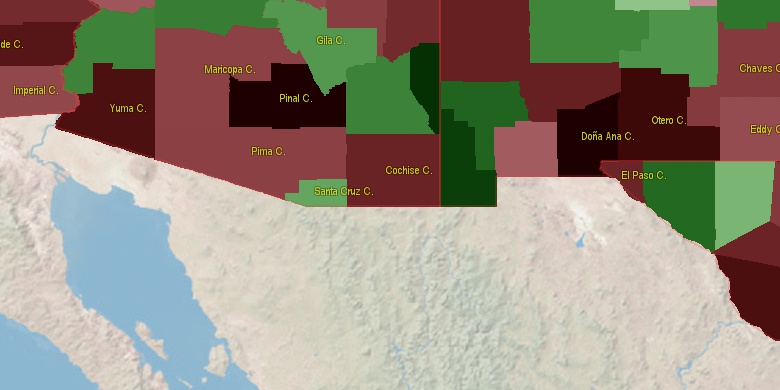
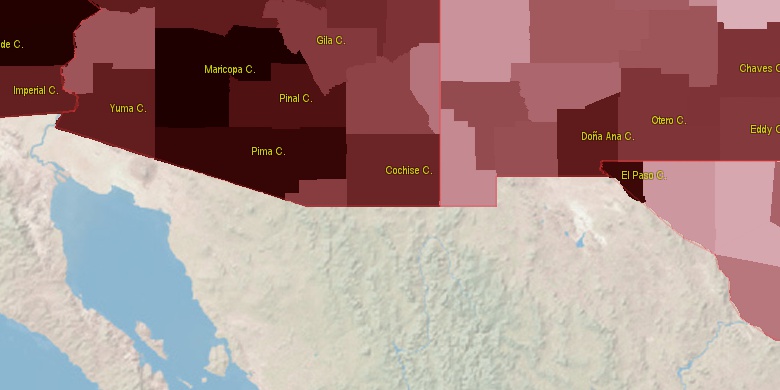
Estimated population for 2014[1]. Population density is in p./sq.mi [4]. Changes are for period 2010-2015. Value is %/year. Boundary lines are approx. 2012 [5]. Click on flag to hide it.
Population • Density • Changes • Legends • Position

[1890-1900] NAN %/yr
[1900-1910] NAN %/yr
[1910-1920] +INF %/yr
[1920-1930] +1.48 %/yr
[1930-1940] -0.41 %/yr
[1940-1950] +0.55 %/yr
[1950-1960] -0.27 %/yr
[1960-1970] -0.47 %/yr
[1970-1980] +2.48 %/yr
[1980-1990] -0.15 %/yr
[1990-2000] -0.05 %/yr
[2000-2005] -3.53 %/yr
[2005-2010] -0.25 %/yr
[2010-2014] -0.22 %/yr
Looking for settlements in Hidalgo County? Visit this page: Settlements in Hidalgo County, NM
Population of Hidalgo County by age groups male (M) and female (F)[1b]
| Age Gr. | (M) | (F) | Total |
| 0 to 4 | 152 | 146 | 298 |
| 5 to 9 | 145 | 149 | 294 |
| 10 to 14 | 148 | 145 | 293 |
| 15 to 19 | 170 | 135 | 305 |
| 20 to 24 | 156 | 131 | 287 |
| 25 to 29 | 121 | 123 | 244 |
| 30 to 34 | 169 | 111 | 280 |
| 35 to 39 | 93 | 100 | 193 |
| 40 to 44 | 103 | 114 | 217 |
| 45 to 49 | 154 | 156 | 310 |
| 50 to 54 | 183 | 170 | 353 |
| 55 to 59 | 141 | 152 | 293 |
| 60 to 64 | 160 | 162 | 322 |
| 65 to 69 | 142 | 134 | 276 |
| 70 to 74 | 103 | 106 | 209 |
| 75 to 79 | 72 | 85 | 157 |
| 80 to 84 | 54 | 52 | 106 |
| 85+ | 43 | 80 | 123 |
Hidalgo County resident population estimates by Sex, Race, and Hispanic Origin[1b]. For full list of abbrevations see: population.us/about page.
| Race | Male | Female | Total |
| WAC | 2236 | 2177 | 4,413 |
| WA | 2213 | 2151 | 4,364 |
| H | 1319 | 1290 | 2,609 |
| HWAC | 1289 | 1255 | 2,544 |
| HWA | 1282 | 1248 | 2,530 |
| NH | 990 | 961 | 1,951 |
| NHWAC | 947 | 922 | 1,869 |
| NHWA | 931 | 903 | 1,834 |
| BAC | 35 | 48 | 83 |
| IAC | 40 | 36 | 76 |
| BA | 25 | 35 | 60 |
| IA | 29 | 24 | 53 |
| TOM | 24 | 28 | 52 |
| NHBAC | 23 | 27 | 50 |
| HIAC | 22 | 18 | 40 |
| AAC | 23 | 16 | 39 |
| NHTOM | 17 | 21 | 38 |
| HIA | 20 | 16 | 36 |
| NHIAC | 18 | 18 | 36 |
| NHBA | 17 | 18 | 35 |
| NHAAC | 19 | 14 | 33 |
| HBAC | 12 | 21 | 33 |
| AA | 16 | 11 | 27 |
| NHAA | 15 | 10 | 25 |
| HBA | 8 | 17 | 25 |
| NHIA | 9 | 8 | 17 |
| HTOM | 7 | 7 | 14 |
| HAAC | 4 | 2 | 6 |
| NAC | 3 | 2 | 5 |
| NA | 2 | 2 | 4 |
| HNAC | 2 | 1 | 3 |
| HNA | 1 | 1 | 2 |
| NHNA | 1 | 1 | 2 |
| NHNAC | 1 | 1 | 2 |
| HAA | 1 | 1 | 2 |
• El Paso County population
147.6 mi,  93°
93°
• Doña Ana County
116.6 mi,  74°
74°
• Cochise County
60.2 mi,  266°
266°
• Santa Cruz County
125.7 mi,  258°
258°
• Graham County
97 mi,  317°
317°
• Grant County
61.5 mi,  20°
20°
• Luna County
62.1 mi, 71°
• Sierra County
124.2 mi,  47°
47°
• Greenlee County
96.9 mi,  342°
342°
• Catron County
140 mi,  8°
8°
[0] Calculated by population.us from last known population growth rate, not official data.
[1] County population - 2014, archived from the original, retrieved 02/23/2016
[1b] Annual County Resident Population Estimates by Age, Sex, Race, and Hispanic Origin, (used only data for 2014) archived from the original, retrieved 02/23/2016
[2] County population - 2000-2010, archived from the original, retrieved 02/23/2016
[3] Population of States and Counties of the United States: 1790 to 1992, PDF, 15 Mb, census.gov, retrieved 02/23/2016
[4] County area, latitude longitude data, retrieved 02/23/2016
[5] County boundaries, CSV files on boundaries.us, retrived 03/18/2016
*Grant New Mexico Notes
Page generated in 0.02 seconds© 2016 population.us | Terms of use | Contact