Last official estimated population of Cochise County was 131,868 (year 2014)[1]. This was 0.041% of total US population and 1.9% of total Arizona state population. Area of Cochise County is 6,218.6 mi² (=16106 km²), in this year population density was 21.21 p/mi². If population growth rate would be same as in period 2010-2014 (+0.1%/yr), Cochise County population in 2026 would be 133,446 [0].
Historical population of Cochise County for period 1890-2014 [1] , [2] , [3]:
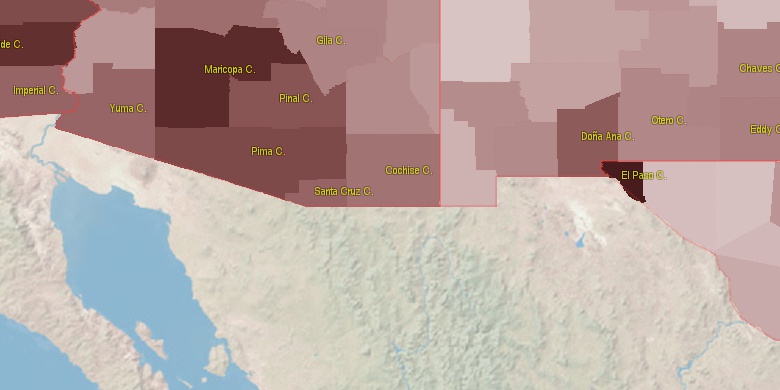
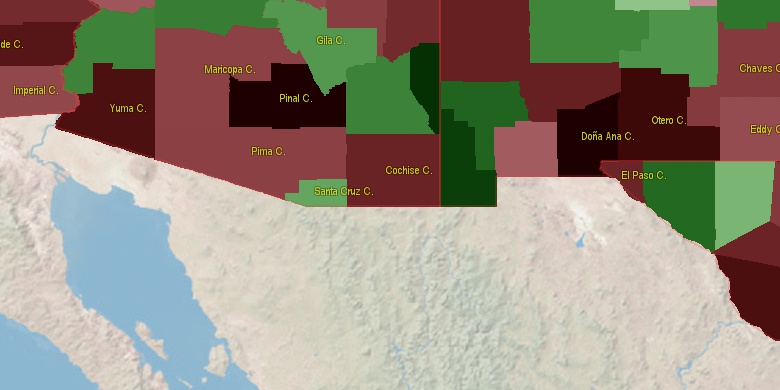
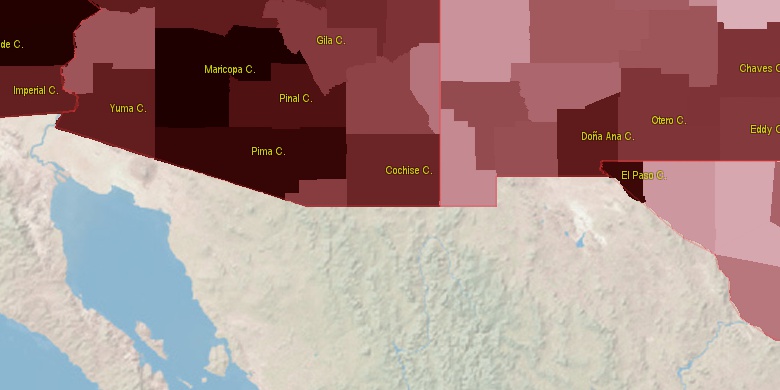
Estimated population for 2014[1]. Population density is in p./sq.mi [4]. Changes are for period 2010-2015. Value is %/year. Boundary lines are approx. 2012 [5]. Click on flag to hide it.
Population • Density • Changes • Legends • Position

[1890-1900] +2.92 %/yr
[1900-1910] +14.1 %/yr
[1910-1920] +3 %/yr
[1920-1930] -1.24 %/yr
[1930-1940] -1.67 %/yr
[1940-1950] -0.95 %/yr
[1950-1960] +5.74 %/yr
[1960-1970] +1.18 %/yr
[1970-1980] +3.3 %/yr
[1980-1990] +1.31 %/yr
[1990-2000] +1.89 %/yr
[2000-2005] +1.33 %/yr
[2005-2010] +0.87 %/yr
[2010-2014] +0.1 %/yr
Looking for settlements in Cochise County? Visit this page: Settlements in Cochise County, AZ
Population of Cochise County by age groups male (M) and female (F)[1b]
| Age Gr. | (M) | (F) | Total |
| 0 to 4 | 4176 | 4067 | 8,243 |
| 5 to 9 | 4083 | 3889 | 7,972 |
| 10 to 14 | 3870 | 3836 | 7,706 |
| 15 to 19 | 4205 | 3710 | 7,915 |
| 20 to 24 | 4400 | 3567 | 7,967 |
| 25 to 29 | 4481 | 3558 | 8,039 |
| 30 to 34 | 4531 | 3766 | 8,297 |
| 35 to 39 | 3630 | 3297 | 6,927 |
| 40 to 44 | 3449 | 3127 | 6,576 |
| 45 to 49 | 3551 | 3535 | 7,086 |
| 50 to 54 | 4016 | 4148 | 8,164 |
| 55 to 59 | 4107 | 4582 | 8,689 |
| 60 to 64 | 4085 | 4391 | 8,476 |
| 65 to 69 | 3919 | 4112 | 8,031 |
| 70 to 74 | 3246 | 3484 | 6,730 |
| 75 to 79 | 2441 | 2471 | 4,912 |
| 80 to 84 | 1470 | 1579 | 3,049 |
| 85+ | 1111 | 1558 | 2,669 |
Cochise County resident population estimates by Sex, Race, and Hispanic Origin[1b]. For full list of abbrevations see: population.us/about page.
| Race | Male | Female | Total |
| WAC | 58562 | 56944 | 115,506 |
| WA | 56790 | 55182 | 111,972 |
| NH | 42859 | 40555 | 83,414 |
| NHWAC | 38075 | 36096 | 74,171 |
| NHWA | 36761 | 34791 | 71,552 |
| H | 21912 | 22122 | 44,034 |
| HWAC | 20487 | 20848 | 41,335 |
| HWA | 20029 | 20391 | 40,420 |
| BAC | 4094 | 3290 | 7,384 |
| NHBAC | 3467 | 2676 | 6,143 |
| BA | 3389 | 2566 | 5,955 |
| NHBA | 2917 | 2106 | 5,023 |
| AAC | 1874 | 2428 | 4,302 |
| TOM | 2003 | 1994 | 3,997 |
| IAC | 2009 | 1759 | 3,768 |
| NHAAC | 1567 | 2143 | 3,710 |
| NHTOM | 1478 | 1482 | 2,960 |
| AA | 1116 | 1685 | 2,801 |
| NHAA | 950 | 1544 | 2,494 |
| IA | 1232 | 993 | 2,225 |
| NHIAC | 1079 | 917 | 1,996 |
| HIAC | 930 | 842 | 1,772 |
| HBAC | 627 | 614 | 1,241 |
| HIA | 647 | 562 | 1,209 |
| HTOM | 525 | 512 | 1,037 |
| NHIA | 585 | 431 | 1,016 |
| HBA | 472 | 460 | 932 |
| NAC | 448 | 480 | 928 |
| NHNAC | 316 | 375 | 691 |
| HAAC | 307 | 285 | 592 |
| NA | 241 | 257 | 498 |
| NHNA | 168 | 201 | 369 |
| HAA | 166 | 141 | 307 |
| HNAC | 132 | 105 | 237 |
| HNA | 73 | 56 | 129 |
• Pima County population
119.3 mi,  279°
279°
• Pinal County
119.1 mi,  308°
308°
• Gila County
147.5 mi,  335°
335°
• Santa Cruz County
66.6 mi,  250°
250°
• Graham County
75.7 mi,  355°
355°
• Grant County
102.1 mi,  52°
52°
• Luna County
121.2 mi,  78°
78°
• Greenlee County
101.5 mi,  17°
17°
• Hidalgo County
60.2 mi,  86°
86°
• Catron County
163.5 mi,  29°
29°
[0] Calculated by population.us from last known population growth rate, not official data.
[1] County population - 2014, archived from the original, retrieved 02/23/2016
[1b] Annual County Resident Population Estimates by Age, Sex, Race, and Hispanic Origin, (used only data for 2014) archived from the original, retrieved 02/23/2016
[2] County population - 2000-2010, archived from the original, retrieved 02/23/2016
[3] Population of States and Counties of the United States: 1790 to 1992, PDF, 15 Mb, census.gov, retrieved 02/23/2016
[4] County area, latitude longitude data, retrieved 02/23/2016
[5] County boundaries, CSV files on boundaries.us, retrived 03/18/2016
*Pima Arizona Notes
Page generated in 0.003 seconds© 2016 population.us | Terms of use | Contact