Last official estimated population of Red River County was 12,851 (year 2014)[1]. This was 0.004% of total US population and 0% of total Texas state population. Area of Red River County is 1,056.7 mi² (=2736.9 km²), in this year population density was 12.16 p/mi². If population growth rate would be same as in period 2010-2014 (-0.02%/yr), Red River County population in 2026 would be 12,824 [0].
Historical population of Red River County for period 1850-2014 [1] , [2] , [3]:
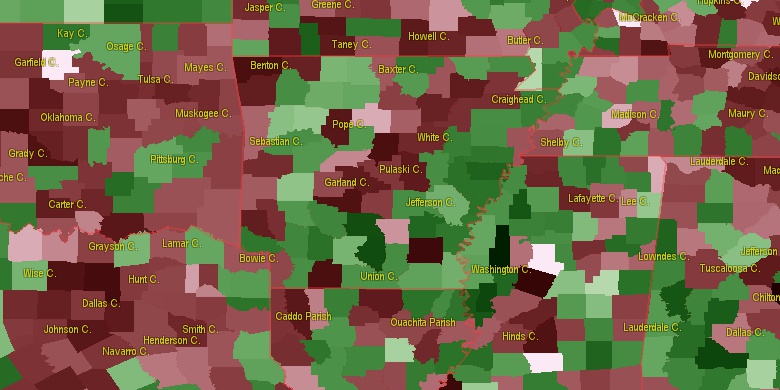
Estimated population for 2014[1]. Population density is in p./sq.mi [4]. Changes are for period 2010-2015. Value is %/year. Boundary lines are approx. 2012 [5]. Click on flag to hide it.
Population • Density • Changes • Legends • Position


[1850-1860] +8.13 %/yr
[1860-1870] +2.24 %/yr
[1870-1880] +4.9 %/yr
[1880-1890] +2.24 %/yr
[1890-1900] +3.37 %/yr
[1900-1910] -0.45 %/yr
[1910-1920] +2.29 %/yr
[1920-1930] -1.46 %/yr
[1930-1940] -0.38 %/yr
[1940-1950] -3.04 %/yr
[1950-1960] -3.26 %/yr
[1960-1970] -0.92 %/yr
[1970-1980] +1.19 %/yr
[1980-1990] -1.17 %/yr
[1990-2000] -0 %/yr
[2000-2005] -1.25 %/yr
[2005-2010] -0.88 %/yr
[2010-2014] -0.02 %/yr
Looking for settlements in Red River County? Visit this page: Settlements in Red River County, TX
Population of Red River County by age groups male (M) and female (F)[1b]
| Age Gr. | (M) | (F) | Total |
| 0 to 4 | 298 | 349 | 647 |
| 5 to 9 | 354 | 335 | 689 |
| 10 to 14 | 404 | 331 | 735 |
| 15 to 19 | 362 | 339 | 701 |
| 20 to 24 | 349 | 325 | 674 |
| 25 to 29 | 319 | 307 | 626 |
| 30 to 34 | 323 | 332 | 655 |
| 35 to 39 | 279 | 322 | 601 |
| 40 to 44 | 360 | 374 | 734 |
| 45 to 49 | 357 | 400 | 757 |
| 50 to 54 | 453 | 469 | 922 |
| 55 to 59 | 436 | 494 | 930 |
| 60 to 64 | 468 | 466 | 934 |
| 65 to 69 | 392 | 459 | 851 |
| 70 to 74 | 357 | 394 | 751 |
| 75 to 79 | 242 | 305 | 547 |
| 80 to 84 | 141 | 207 | 348 |
| 85+ | 123 | 221 | 344 |
Red River County resident population estimates by Sex, Race, and Hispanic Origin[1b]. For full list of abbrevations see: population.us/about page.
| Race | Male | Female | Total |
| NH | 5558 | 5993 | 11,551 |
| WAC | 4858 | 5179 | 10,037 |
| WA | 4756 | 5081 | 9,837 |
| NHWAC | 4467 | 4801 | 9,268 |
| NHWA | 4385 | 4715 | 9,100 |
| BAC | 1078 | 1178 | 2,256 |
| NHBAC | 1047 | 1145 | 2,192 |
| BA | 1030 | 1140 | 2,170 |
| NHBA | 1006 | 1114 | 2,120 |
| H | 459 | 436 | 895 |
| HWAC | 391 | 378 | 769 |
| HWA | 371 | 366 | 737 |
| IAC | 154 | 141 | 295 |
| TOM | 110 | 101 | 211 |
| NHIAC | 101 | 108 | 209 |
| IA | 99 | 90 | 189 |
| NHTOM | 88 | 89 | 177 |
| NHIA | 60 | 61 | 121 |
| HIAC | 53 | 33 | 86 |
| HIA | 39 | 29 | 68 |
| AAC | 35 | 32 | 67 |
| HBAC | 31 | 33 | 64 |
| NHAAC | 30 | 28 | 58 |
| HBA | 24 | 26 | 50 |
| AA | 22 | 16 | 38 |
| HTOM | 22 | 12 | 34 |
| NHAA | 19 | 14 | 33 |
| NAC | 6 | 3 | 9 |
| HAAC | 5 | 4 | 9 |
| NHNAC | 5 | 2 | 7 |
| HAA | 3 | 2 | 5 |
| HNAC | 1 | 1 | 2 |
| NA | 0 | 1 | 1 |
| HNA | 0 | 1 | 1 |
| NHNA | 0 | 0 | 0 |
• Bowie County population
38 mi,  108°
108°
• Lamar County
30.2 mi,  276°
276°
• Hopkins County
44.1 mi,  222°
222°
• McCurtain County
38 mi,  25°
25°
• Titus County
28.4 mi,  170°
170°
• Choctaw County
40.5 mi,  314°
314°
• Morris County
39.3 mi,  152°
152°
• Camp County
44.7 mi, 174°
• Franklin County
32.2 mi,  197°
197°
• Delta County
39.5 mi,  245°
245°
[0] Calculated by population.us from last known population growth rate, not official data.
[1] County population - 2014, archived from the original, retrieved 02/23/2016
[1b] Annual County Resident Population Estimates by Age, Sex, Race, and Hispanic Origin, (used only data for 2014) archived from the original, retrieved 02/23/2016
[2] County population - 2000-2010, archived from the original, retrieved 02/23/2016
[3] Population of States and Counties of the United States: 1790 to 1992, PDF, 15 Mb, census.gov, retrieved 02/23/2016
[4] County area, latitude longitude data, retrieved 02/23/2016
[5] County boundaries, CSV files on boundaries.us, retrived 03/18/2016
Page generated in 0.019 seconds© 2016 population.us | Terms of use | Contact