Last official estimated population of Morris County was 12,921 (year 2014)[1]. This was 0.004% of total US population and 0% of total Texas state population. Area of Morris County is 258.7 mi² (=670 km²), in this year population density was 49.95 p/mi². If population growth rate would be same as in period 2010-2014 (-0.03%/yr), Morris County population in 2026 would be 12,882 [0].
Historical population of Morris County for period 1880-2014 [1] , [2] , [3]:
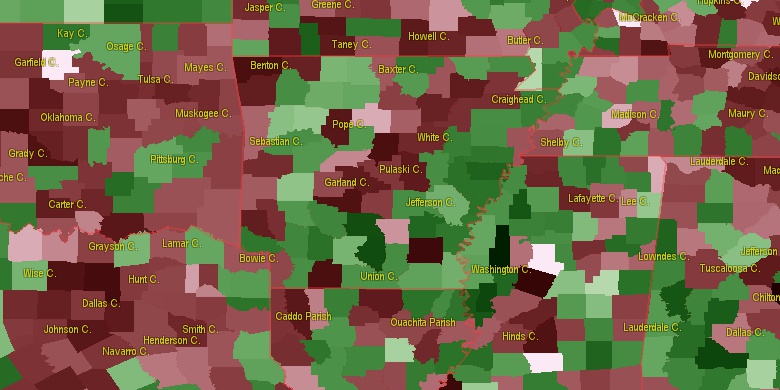
Estimated population for 2014[1]. Population density is in p./sq.mi [4]. Changes are for period 2010-2015. Value is %/year. Boundary lines are approx. 2012 [5]. Click on flag to hide it.
Population • Density • Changes • Legends • Position


[1880-1890] +2.72 %/yr
[1890-1900] +2.25 %/yr
[1900-1910] +2.42 %/yr
[1910-1920] -0.14 %/yr
[1920-1930] -0.26 %/yr
[1930-1940] -0.22 %/yr
[1940-1950] -0.39 %/yr
[1950-1960] +2.92 %/yr
[1960-1970] -0.21 %/yr
[1970-1980] +1.74 %/yr
[1980-1990] -1.02 %/yr
[1990-2000] -0.12 %/yr
[2000-2005] -0.05 %/yr
[2005-2010] -0.12 %/yr
[2010-2014] -0.03 %/yr
Looking for settlements in Morris County? Visit this page: Settlements in Morris County, TX
Population of Morris County by age groups male (M) and female (F)[1b]
| Age Gr. | (M) | (F) | Total |
| 0 to 4 | 384 | 418 | 802 |
| 5 to 9 | 423 | 379 | 802 |
| 10 to 14 | 422 | 385 | 807 |
| 15 to 19 | 400 | 386 | 786 |
| 20 to 24 | 377 | 378 | 755 |
| 25 to 29 | 346 | 349 | 695 |
| 30 to 34 | 369 | 370 | 739 |
| 35 to 39 | 302 | 351 | 653 |
| 40 to 44 | 330 | 375 | 705 |
| 45 to 49 | 298 | 341 | 639 |
| 50 to 54 | 415 | 446 | 861 |
| 55 to 59 | 427 | 547 | 974 |
| 60 to 64 | 416 | 429 | 845 |
| 65 to 69 | 380 | 425 | 805 |
| 70 to 74 | 302 | 332 | 634 |
| 75 to 79 | 261 | 301 | 562 |
| 80 to 84 | 149 | 203 | 352 |
| 85+ | 112 | 215 | 327 |
Morris County resident population estimates by Sex, Race, and Hispanic Origin[1b]. For full list of abbrevations see: population.us/about page.
| Race | Male | Female | Total |
| NH | 5519 | 6062 | 11,581 |
| WAC | 4630 | 4929 | 9,559 |
| WA | 4512 | 4804 | 9,316 |
| NHWAC | 4094 | 4433 | 8,527 |
| NHWA | 3982 | 4320 | 8,302 |
| BAC | 1443 | 1642 | 3,085 |
| NHBAC | 1407 | 1602 | 3,009 |
| BA | 1368 | 1567 | 2,935 |
| NHBA | 1337 | 1533 | 2,870 |
| H | 594 | 568 | 1,162 |
| HWAC | 536 | 496 | 1,032 |
| HWA | 530 | 484 | 1,014 |
| TOM | 127 | 129 | 256 |
| NHTOM | 120 | 116 | 236 |
| IAC | 106 | 117 | 223 |
| NHIAC | 82 | 83 | 165 |
| IA | 70 | 82 | 152 |
| AAC | 49 | 60 | 109 |
| NHAAC | 49 | 55 | 104 |
| NHIA | 49 | 54 | 103 |
| HBAC | 36 | 40 | 76 |
| AA | 28 | 42 | 70 |
| NHAA | 28 | 38 | 66 |
| HBA | 31 | 34 | 65 |
| HIAC | 24 | 34 | 58 |
| HIA | 21 | 28 | 49 |
| NAC | 14 | 13 | 27 |
| HTOM | 7 | 13 | 20 |
| NHNAC | 9 | 7 | 16 |
| NA | 8 | 6 | 14 |
| HNAC | 5 | 6 | 11 |
| HNA | 5 | 5 | 10 |
| HAAC | 0 | 5 | 5 |
| NHNA | 3 | 1 | 4 |
| HAA | 0 | 4 | 4 |
• Gregg County population
43.8 mi,  186°
186°
• Bowie County
28.9 mi,  38°
38°
• Wood County
44.2 mi,  238°
238°
• Upshur County
29 mi,  204°
204°
• Titus County
15.2 mi,  296°
296°
• Cass County
21.7 mi,  95°
95°
• Red River County
39.3 mi,  332°
332°
• Camp County
17.4 mi, 235°
• Franklin County
28.5 mi,  278°
278°
• Marion County
30.9 mi,  135°
135°
[0] Calculated by population.us from last known population growth rate, not official data.
[1] County population - 2014, archived from the original, retrieved 02/23/2016
[1b] Annual County Resident Population Estimates by Age, Sex, Race, and Hispanic Origin, (used only data for 2014) archived from the original, retrieved 02/23/2016
[2] County population - 2000-2010, archived from the original, retrieved 02/23/2016
[3] Population of States and Counties of the United States: 1790 to 1992, PDF, 15 Mb, census.gov, retrieved 02/23/2016
[4] County area, latitude longitude data, retrieved 02/23/2016
[5] County boundaries, CSV files on boundaries.us, retrived 03/18/2016
*Titus Texas Notes
Page generated in 0.019 seconds© 2016 population.us | Terms of use | Contact