Last official estimated population of Bowie County was 92,656 (year 2014)[1]. This was 0.029% of total US population and 0.3% of total Texas state population. Area of Bowie County is 923.0 mi² (=2390.5 km²), in this year population density was 100.39 p/mi². If population growth rate would be same as in period 2010-2014 (+0.02%/yr), Bowie County population in 2026 would be 92,930 [0].
Historical population of Bowie County for period 1850-2014 [1] , [2] , [3]:
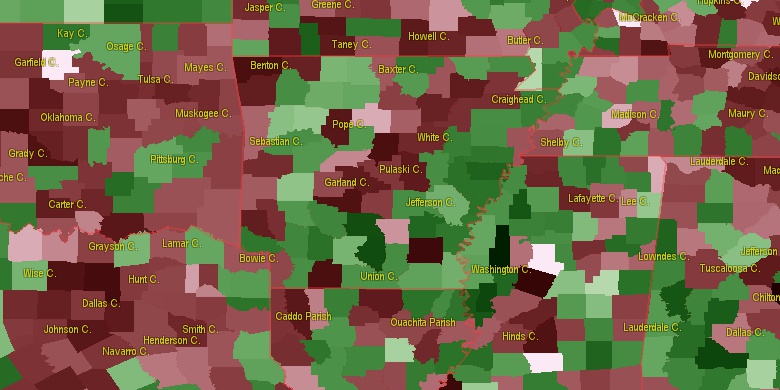
Estimated population for 2014[1]. Population density is in p./sq.mi [4]. Changes are for period 2010-2015. Value is %/year. Boundary lines are approx. 2012 [5]. Click on flag to hide it.
Population • Density • Changes • Legends • Position


[1850-1860] +5.66 %/yr
[1860-1870] -0.75 %/yr
[1870-1880] +8.88 %/yr
[1880-1890] +6.34 %/yr
[1890-1900] +2.79 %/yr
[1900-1910] +2.7 %/yr
[1910-1920] +1.26 %/yr
[1920-1930] +2.09 %/yr
[1930-1940] +0.33 %/yr
[1940-1950] +2.13 %/yr
[1950-1960] -0.33 %/yr
[1960-1970] +1.24 %/yr
[1970-1980] +1.05 %/yr
[1980-1990] +0.81 %/yr
[1990-2000] +0.9 %/yr
[2000-2005] -0.01 %/yr
[2005-2010] +0.73 %/yr
[2010-2014] +0.02 %/yr
Looking for settlements in Bowie County? Visit this page: Settlements in Bowie County, TX
Population of Bowie County by age groups male (M) and female (F)[1b]
| Age Gr. | (M) | (F) | Total |
| 0 to 4 | 3102 | 2934 | 6,036 |
| 5 to 9 | 3169 | 2966 | 6,135 |
| 10 to 14 | 3205 | 3055 | 6,260 |
| 15 to 19 | 3116 | 2927 | 6,043 |
| 20 to 24 | 3418 | 2788 | 6,206 |
| 25 to 29 | 3401 | 2860 | 6,261 |
| 30 to 34 | 3288 | 2916 | 6,204 |
| 35 to 39 | 3249 | 2798 | 6,047 |
| 40 to 44 | 3167 | 2871 | 6,038 |
| 45 to 49 | 3064 | 2793 | 5,857 |
| 50 to 54 | 3185 | 3217 | 6,402 |
| 55 to 59 | 2987 | 3061 | 6,048 |
| 60 to 64 | 2574 | 2752 | 5,326 |
| 65 to 69 | 2243 | 2473 | 4,716 |
| 70 to 74 | 1576 | 1945 | 3,521 |
| 75 to 79 | 1068 | 1375 | 2,443 |
| 80 to 84 | 678 | 1094 | 1,772 |
| 85+ | 601 | 1359 | 1,960 |
Bowie County resident population estimates by Sex, Race, and Hispanic Origin[1b]. For full list of abbrevations see: population.us/about page.
| Race | Male | Female | Total |
| NH | 42838 | 43611 | 86,449 |
| WAC | 34425 | 33654 | 68,079 |
| WA | 33398 | 32804 | 66,202 |
| NHWAC | 30615 | 31451 | 62,066 |
| NHWA | 29766 | 30714 | 60,480 |
| BAC | 12168 | 11976 | 24,144 |
| NHBAC | 11868 | 11728 | 23,596 |
| BA | 11580 | 11455 | 23,035 |
| NHBA | 11358 | 11258 | 22,616 |
| H | 4253 | 2573 | 6,826 |
| HWAC | 3810 | 2203 | 6,013 |
| HWA | 3632 | 2090 | 5,722 |
| TOM | 1107 | 947 | 2,054 |
| NHTOM | 912 | 823 | 1,735 |
| IAC | 913 | 789 | 1,702 |
| AAC | 648 | 682 | 1,330 |
| NHAAC | 603 | 646 | 1,249 |
| NHIAC | 637 | 598 | 1,235 |
| AA | 471 | 512 | 983 |
| NHAA | 457 | 499 | 956 |
| IA | 486 | 429 | 915 |
| NHIA | 310 | 291 | 601 |
| HBAC | 300 | 248 | 548 |
| HIAC | 276 | 191 | 467 |
| HBA | 222 | 197 | 419 |
| HTOM | 195 | 124 | 319 |
| HIA | 176 | 138 | 314 |
| NAC | 111 | 87 | 198 |
| NHNAC | 80 | 68 | 148 |
| NA | 49 | 37 | 86 |
| HAAC | 45 | 36 | 81 |
| NHNA | 35 | 26 | 61 |
| HNAC | 31 | 19 | 50 |
| HAA | 14 | 13 | 27 |
| HNA | 14 | 11 | 25 |
• Miller County population
31.6 mi,  107°
107°
• Titus County
35.3 mi,  243°
243°
• Cass County
25.3 mi,  171°
171°
• Hempstead County
47.7 mi,  65°
65°
• Sevier County
39.3 mi,  15°
15°
• Little River County
20.7 mi,  32°
32°
• Morris County
28.9 mi,  218°
218°
• Red River County
38 mi,  288°
288°
• Camp County
45.8 mi, 224°
• Marion County
44.9 mi,  175°
175°
[0] Calculated by population.us from last known population growth rate, not official data.
[1] County population - 2014, archived from the original, retrieved 02/23/2016
[1b] Annual County Resident Population Estimates by Age, Sex, Race, and Hispanic Origin, (used only data for 2014) archived from the original, retrieved 02/23/2016
[2] County population - 2000-2010, archived from the original, retrieved 02/23/2016
[3] Population of States and Counties of the United States: 1790 to 1992, PDF, 15 Mb, census.gov, retrieved 02/23/2016
[4] County area, latitude longitude data, retrieved 02/23/2016
[5] County boundaries, CSV files on boundaries.us, retrived 03/18/2016
Page generated in 0.01 seconds© 2016 population.us | Terms of use | Contact