Last official estimated population of Harney County was 7,397 (year 2014)[1]. This was 0.002% of total US population and 0.2% of total Oregon state population. Area of Harney County is 10,226.5 mi² (=26486.5 km²), in this year population density was 0.72 p/mi². If population growth rate would be same as in period 2010-2014 (-0.08%/yr), Harney County population in 2026 would be 7,323 [0].
Historical population of Harney County for period 1890-2014 [1] , [2] , [3]:
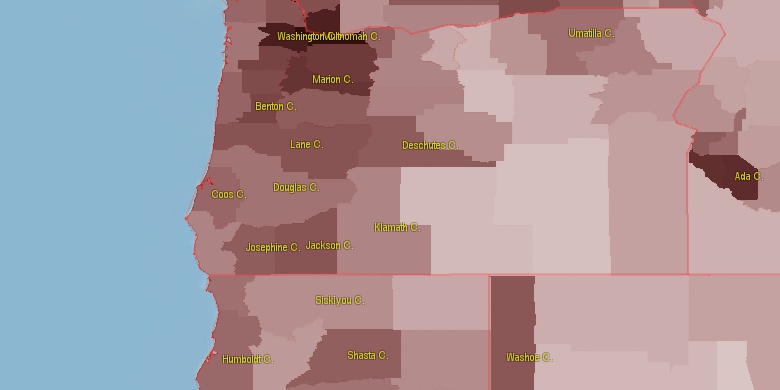
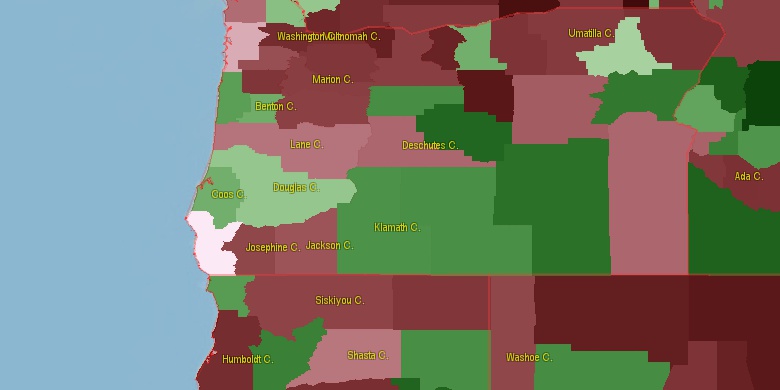
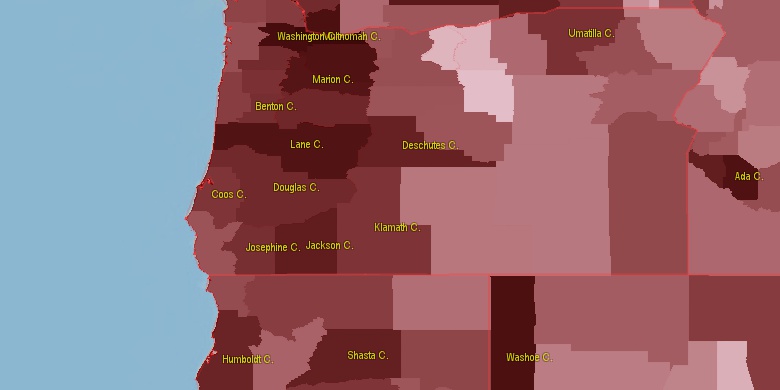
Estimated population for 2014[1]. Population density is in p./sq.mi [4]. Changes are for period 2010-2015. Value is %/year. Boundary lines are approx. 2012 [5]. Click on flag to hide it.
Population • Density • Changes • Legends • Position

[1890-1900] +0.15 %/yr
[1900-1910] +4.56 %/yr
[1910-1920] -0.17 %/yr
[1920-1930] +4.02 %/yr
[1930-1940] -0.96 %/yr
[1940-1950] +1.3 %/yr
[1950-1960] +0.99 %/yr
[1960-1970] +0.68 %/yr
[1970-1980] +1.43 %/yr
[1980-1990] -1.62 %/yr
[1990-2000] +0.75 %/yr
[2000-2005] -1.06 %/yr
[2005-2010] +0.58 %/yr
[2010-2014] -0.08 %/yr
Looking for settlements in Harney County? Visit this page: Settlements in Harney County, OR
Population of Harney County by age groups male (M) and female (F)[1b]
| Age Gr. | (M) | (F) | Total |
| 0 to 4 | 198 | 167 | 365 |
| 5 to 9 | 213 | 188 | 401 |
| 10 to 14 | 220 | 202 | 422 |
| 15 to 19 | 244 | 173 | 417 |
| 20 to 24 | 201 | 163 | 364 |
| 25 to 29 | 156 | 175 | 331 |
| 30 to 34 | 172 | 195 | 367 |
| 35 to 39 | 204 | 200 | 404 |
| 40 to 44 | 179 | 174 | 353 |
| 45 to 49 | 179 | 213 | 392 |
| 50 to 54 | 248 | 268 | 516 |
| 55 to 59 | 296 | 289 | 585 |
| 60 to 64 | 300 | 305 | 605 |
| 65 to 69 | 268 | 247 | 515 |
| 70 to 74 | 221 | 192 | 413 |
| 75 to 79 | 161 | 152 | 313 |
| 80 to 84 | 82 | 113 | 195 |
| 85+ | 63 | 105 | 168 |
Harney County resident population estimates by Sex, Race, and Hispanic Origin[1b]. For full list of abbrevations see: population.us/about page.
| Race | Male | Female | Total |
| NH | 3418 | 3362 | 6,780 |
| WAC | 3426 | 3337 | 6,763 |
| WA | 3321 | 3234 | 6,555 |
| NHWAC | 3260 | 3194 | 6,454 |
| NHWA | 3163 | 3096 | 6,259 |
| IAC | 210 | 205 | 415 |
| NHIAC | 186 | 188 | 374 |
| H | 187 | 159 | 346 |
| HWAC | 166 | 143 | 309 |
| HWA | 158 | 138 | 296 |
| IA | 133 | 144 | 277 |
| NHIA | 116 | 130 | 246 |
| TOM | 115 | 107 | 222 |
| NHTOM | 107 | 102 | 209 |
| BAC | 49 | 40 | 89 |
| NHBAC | 45 | 36 | 81 |
| AAC | 29 | 40 | 69 |
| NHAAC | 28 | 40 | 68 |
| HIAC | 24 | 17 | 41 |
| BA | 27 | 12 | 39 |
| NHBA | 24 | 10 | 34 |
| AA | 9 | 23 | 32 |
| HIA | 17 | 14 | 31 |
| NHAA | 8 | 23 | 31 |
| HTOM | 8 | 5 | 13 |
| NAC | 7 | 6 | 13 |
| NHNAC | 7 | 6 | 13 |
| HBAC | 4 | 4 | 8 |
| HBA | 3 | 2 | 5 |
| HAAC | 1 | 0 | 1 |
| HAA | 1 | 0 | 1 |
| NHNA | 0 | 1 | 1 |
| NA | 0 | 1 | 1 |
| HNAC | 0 | 0 | 0 |
| HNA | 0 | 0 | 0 |
• Canyon County population
120.8 mi,  71°
71°
• Deschutes County
126.7 mi,  297°
297°
• Malheur County
70.3 mi,  83°
83°
• Payette County
129.4 mi,  59°
59°
• Crook County
102.7 mi,  317°
317°
• Humboldt County
122.6 mi,  158°
158°
• Baker County
130.3 mi,  29°
29°
• Lake County
73.5 mi,  254°
254°
• Grant County
98.9 mi,  359°
359°
• Wheeler County
126.6 mi,  335°
335°
[0] Calculated by population.us from last known population growth rate, not official data.
[1] County population - 2014, archived from the original, retrieved 02/23/2016
[1b] Annual County Resident Population Estimates by Age, Sex, Race, and Hispanic Origin, (used only data for 2014) archived from the original, retrieved 02/23/2016
[2] County population - 2000-2010, archived from the original, retrieved 02/23/2016
[3] Population of States and Counties of the United States: 1790 to 1992, PDF, 15 Mb, census.gov, retrieved 02/23/2016
[4] County area, latitude longitude data, retrieved 02/23/2016
[5] County boundaries, CSV files on boundaries.us, retrived 03/18/2016
*Grant Oregon Notes
Page generated in 0.019 seconds© 2016 population.us | Terms of use | Contact