Last official estimated population of Grant County was 7,451 (year 2014)[1]. This was 0.002% of total US population and 0.2% of total Oregon state population. Area of Grant County is 4,529.3 mi² (=11730.7 km²), in this year population density was 1.65 p/mi². If population growth rate would be same as in period 2010-2014 (+0.02%/yr), Grant County population in 2026 would be 7,469 [0].
Historical population of Grant County for period 1870-2014 [1] , [2] , [3]:
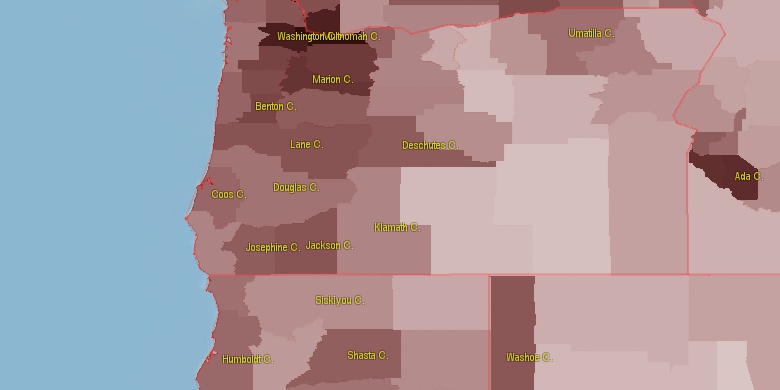
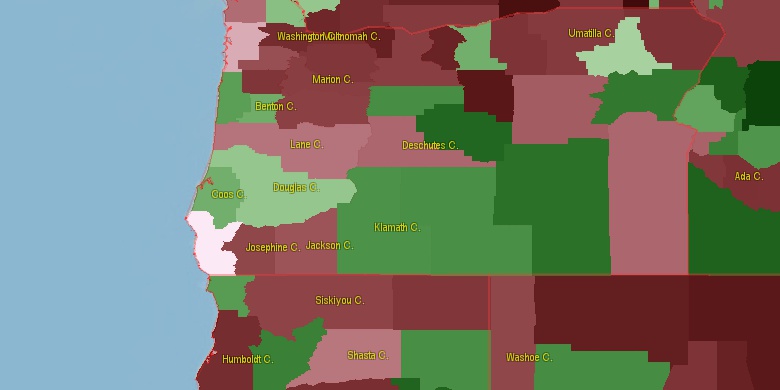
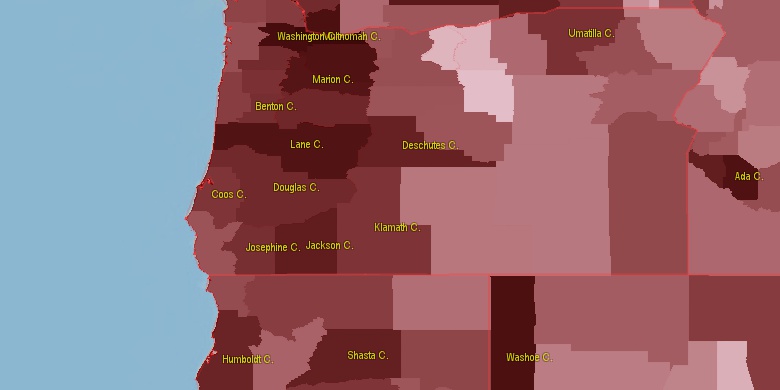
Estimated population for 2014[1]. Population density is in p./sq.mi [4]. Changes are for period 2010-2015. Value is %/year. Boundary lines are approx. 2012 [5]. Click on flag to hide it.
Population • Density • Changes • Legends • Position

[1870-1880] +6.69 %/yr
[1880-1890] +1.67 %/yr
[1890-1900] +1.59 %/yr
[1900-1910] -0.59 %/yr
[1910-1920] -0.2 %/yr
[1920-1930] +0.78 %/yr
[1930-1940] +0.72 %/yr
[1940-1950] +2.7 %/yr
[1950-1960] -0.75 %/yr
[1960-1970] -0.99 %/yr
[1970-1980] +1.61 %/yr
[1980-1990] -0.44 %/yr
[1990-2000] +0.1 %/yr
[2000-2005] -1.41 %/yr
[2005-2010] +0.15 %/yr
[2010-2014] +0.02 %/yr
Looking for settlements in Grant County? Visit this page: Settlements in Grant County, OR
Population of Grant County by age groups male (M) and female (F)[1b]
| Age Gr. | (M) | (F) | Total |
| 0 to 4 | 157 | 177 | 334 |
| 5 to 9 | 186 | 167 | 353 |
| 10 to 14 | 179 | 201 | 380 |
| 15 to 19 | 195 | 187 | 382 |
| 20 to 24 | 149 | 121 | 270 |
| 25 to 29 | 149 | 153 | 302 |
| 30 to 34 | 158 | 173 | 331 |
| 35 to 39 | 165 | 163 | 328 |
| 40 to 44 | 170 | 181 | 351 |
| 45 to 49 | 162 | 197 | 359 |
| 50 to 54 | 260 | 250 | 510 |
| 55 to 59 | 287 | 342 | 629 |
| 60 to 64 | 351 | 340 | 691 |
| 65 to 69 | 297 | 296 | 593 |
| 70 to 74 | 270 | 227 | 497 |
| 75 to 79 | 179 | 188 | 367 |
| 80 to 84 | 133 | 125 | 258 |
| 85+ | 106 | 139 | 245 |
Grant County resident population estimates by Sex, Race, and Hispanic Origin[1b]. For full list of abbrevations see: population.us/about page.
| Race | Male | Female | Total |
| WAC | 3455 | 3539 | 6,994 |
| NH | 3437 | 3498 | 6,935 |
| WA | 3369 | 3440 | 6,809 |
| NHWAC | 3349 | 3421 | 6,770 |
| NHWA | 3278 | 3335 | 6,613 |
| H | 116 | 129 | 245 |
| HWAC | 106 | 118 | 224 |
| IAC | 106 | 108 | 214 |
| HWA | 91 | 105 | 196 |
| TOM | 92 | 103 | 195 |
| NHIAC | 92 | 93 | 185 |
| NHTOM | 77 | 90 | 167 |
| IA | 55 | 43 | 98 |
| NHIA | 49 | 37 | 86 |
| AAC | 37 | 43 | 80 |
| NHAAC | 33 | 42 | 75 |
| BAC | 38 | 27 | 65 |
| NHBAC | 31 | 20 | 51 |
| AA | 19 | 27 | 46 |
| NHAA | 18 | 26 | 44 |
| HIAC | 14 | 15 | 29 |
| HTOM | 15 | 13 | 28 |
| NAC | 12 | 16 | 28 |
| NHNAC | 12 | 14 | 26 |
| BA | 16 | 4 | 20 |
| NHBA | 13 | 2 | 15 |
| HBAC | 7 | 7 | 14 |
| HIA | 6 | 6 | 12 |
| NA | 2 | 10 | 12 |
| NHNA | 2 | 8 | 10 |
| HAAC | 4 | 1 | 5 |
| HBA | 3 | 2 | 5 |
| HAA | 1 | 1 | 2 |
| HNAC | 0 | 2 | 2 |
| HNA | 0 | 2 | 2 |
• Umatilla County population
76.9 mi,  10°
10°
• Union County
74.7 mi,  41°
41°
• Jefferson County
107 mi,  275°
275°
• Crook County
70.9 mi,  251°
251°
• Baker County
66.6 mi,  77°
77°
• Morrow County
70.3 mi,  335°
335°
• Harney County
98.9 mi,  179°
179°
• Gilliam County
87 mi,  314°
314°
• Sherman County
102.5 mi, 307°
• Wheeler County
52.5 mi,  288°
288°
[0] Calculated by population.us from last known population growth rate, not official data.
[1] County population - 2014, archived from the original, retrieved 02/23/2016
[1b] Annual County Resident Population Estimates by Age, Sex, Race, and Hispanic Origin, (used only data for 2014) archived from the original, retrieved 02/23/2016
[2] County population - 2000-2010, archived from the original, retrieved 02/23/2016
[3] Population of States and Counties of the United States: 1790 to 1992, PDF, 15 Mb, census.gov, retrieved 02/23/2016
[4] County area, latitude longitude data, retrieved 02/23/2016
[5] County boundaries, CSV files on boundaries.us, retrived 03/18/2016
*Wasco Oregon Notes
Page generated in 0.019 seconds© 2016 population.us | Terms of use | Contact