Last official estimated population of Baker County was 16,089 (year 2014)[1]. This was 0.005% of total US population and 0.4% of total Oregon state population. Area of Baker County is 3,088.4 mi² (=7998.8 km²), in this year population density was 5.21 p/mi². If population growth rate would be same as in period 2010-2014 (-0.07%/yr), Baker County population in 2026 would be 15,955 [0].
Historical population of Baker County for period 1870-2014 [1] , [2] , [3]:
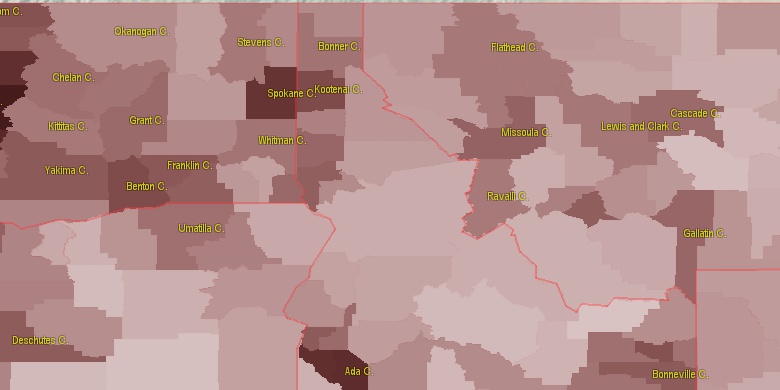
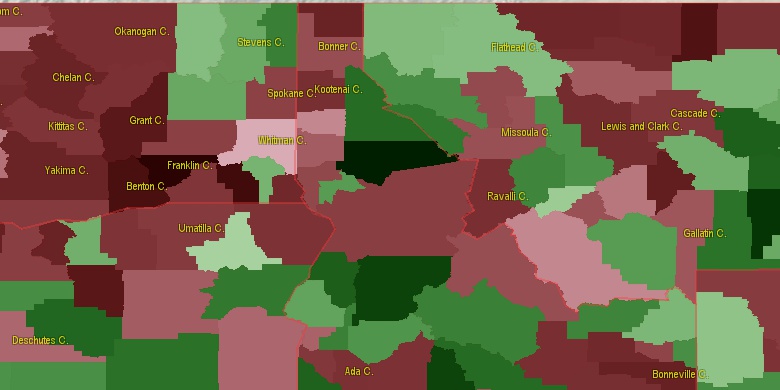
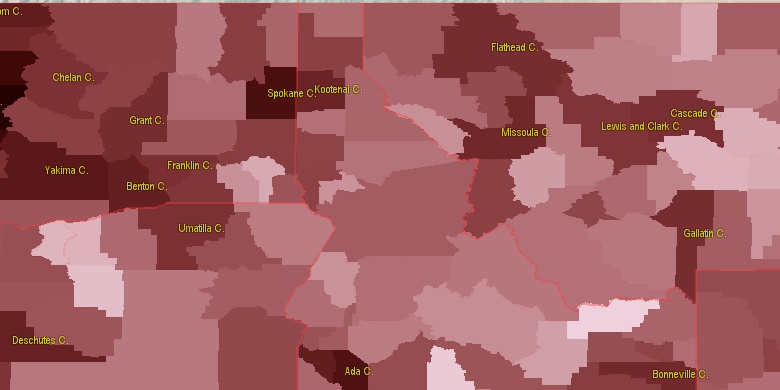
Estimated population for 2014[1]. Population density is in p./sq.mi [4]. Changes are for period 2010-2015. Value is %/year. Boundary lines are approx. 2012 [5]. Click on flag to hide it.
Population • Density • Changes • Legends • Position

[1870-1880] +5.11 %/yr
[1880-1890] +3.89 %/yr
[1890-1900] +8.71 %/yr
[1900-1910] +1.49 %/yr
[1910-1920] -0.08 %/yr
[1920-1930] -0.68 %/yr
[1930-1940] +0.88 %/yr
[1940-1950] -1.23 %/yr
[1950-1960] +0.67 %/yr
[1960-1970] -1.47 %/yr
[1970-1980] +0.79 %/yr
[1980-1990] -0.52 %/yr
[1990-2000] +0.89 %/yr
[2000-2005] -0.8 %/yr
[2005-2010] +0.06 %/yr
[2010-2014] -0.07 %/yr
Looking for settlements in Baker County? Visit this page: Settlements in Baker County, OR
Population of Baker County by age groups male (M) and female (F)[1b]
| Age Gr. | (M) | (F) | Total |
| 0 to 4 | 448 | 392 | 840 |
| 5 to 9 | 440 | 443 | 883 |
| 10 to 14 | 437 | 407 | 844 |
| 15 to 19 | 454 | 402 | 856 |
| 20 to 24 | 436 | 331 | 767 |
| 25 to 29 | 400 | 405 | 805 |
| 30 to 34 | 456 | 409 | 865 |
| 35 to 39 | 399 | 332 | 731 |
| 40 to 44 | 445 | 405 | 850 |
| 45 to 49 | 450 | 450 | 900 |
| 50 to 54 | 542 | 587 | 1,129 |
| 55 to 59 | 605 | 648 | 1,253 |
| 60 to 64 | 677 | 689 | 1,366 |
| 65 to 69 | 598 | 643 | 1,241 |
| 70 to 74 | 515 | 510 | 1,025 |
| 75 to 79 | 373 | 367 | 740 |
| 80 to 84 | 229 | 246 | 475 |
| 85+ | 208 | 281 | 489 |
Baker County resident population estimates by Sex, Race, and Hispanic Origin[1b]. For full list of abbrevations see: population.us/about page.
| Race | Male | Female | Total |
| WAC | 7888 | 7731 | 15,619 |
| NH | 7803 | 7632 | 15,435 |
| WA | 7694 | 7556 | 15,250 |
| NHWAC | 7591 | 7442 | 15,033 |
| NHWA | 7416 | 7289 | 14,705 |
| H | 309 | 315 | 624 |
| HWAC | 297 | 289 | 586 |
| HWA | 278 | 267 | 545 |
| IAC | 224 | 212 | 436 |
| TOM | 202 | 189 | 391 |
| NHIAC | 204 | 183 | 387 |
| NHTOM | 183 | 164 | 347 |
| IA | 108 | 108 | 216 |
| BAC | 121 | 78 | 199 |
| NHIA | 101 | 88 | 189 |
| AAC | 78 | 102 | 180 |
| NHBAC | 109 | 65 | 174 |
| NHAAC | 76 | 93 | 169 |
| AA | 38 | 60 | 98 |
| NHAA | 38 | 59 | 97 |
| BA | 64 | 29 | 93 |
| NHBA | 60 | 27 | 87 |
| HIAC | 20 | 29 | 49 |
| HTOM | 19 | 25 | 44 |
| NAC | 14 | 15 | 29 |
| NHNAC | 13 | 15 | 28 |
| HIA | 7 | 20 | 27 |
| HBAC | 12 | 13 | 25 |
| NA | 6 | 5 | 11 |
| HAAC | 2 | 9 | 11 |
| NHNA | 5 | 5 | 10 |
| HBA | 4 | 2 | 6 |
| HNAC | 1 | 0 | 1 |
| HNA | 1 | 0 | 1 |
| HAA | 0 | 1 | 1 |
• Canyon County population
89.1 mi,  146°
146°
• Umatilla County
79.6 mi,  320°
320°
• Union County
44.1 mi,  340°
340°
• Payette County
67.2 mi,  136°
136°
• Gem County
77.7 mi,  124°
124°
• Washington County
47.4 mi,  111°
111°
• Valley County
100.9 mi,  87°
87°
• Grant County
66.6 mi,  257°
257°
• Wallowa County
66.3 mi,  21°
21°
• Adams County
61.5 mi,  78°
78°
[0] Calculated by population.us from last known population growth rate, not official data.
[1] County population - 2014, archived from the original, retrieved 02/23/2016
[1b] Annual County Resident Population Estimates by Age, Sex, Race, and Hispanic Origin, (used only data for 2014) archived from the original, retrieved 02/23/2016
[2] County population - 2000-2010, archived from the original, retrieved 02/23/2016
[3] Population of States and Counties of the United States: 1790 to 1992, PDF, 15 Mb, census.gov, retrieved 02/23/2016
[4] County area, latitude longitude data, retrieved 02/23/2016
[5] County boundaries, CSV files on boundaries.us, retrived 03/18/2016
*Wasco Oregon Notes
Page generated in 0.027 seconds© 2016 population.us | Terms of use | Contact