Last official estimated population of Crook County was 20,891 (year 2014)[1]. This was 0.007% of total US population and 0.5% of total Oregon state population. Area of Crook County is 2,987.3 mi² (=7737 km²), in this year population density was 6.99 p/mi². If population growth rate would be same as in period 2010-2014 (-0.1%/yr), Crook County population in 2026 would be 20,632 [0].
Historical population of Crook County for period 1890-2014 [1] , [2] , [3]:
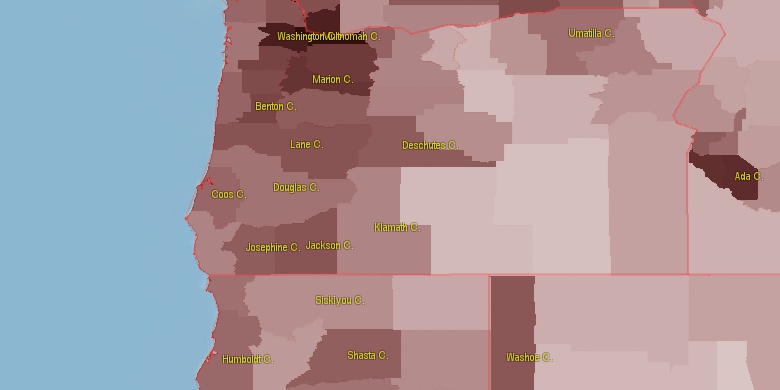
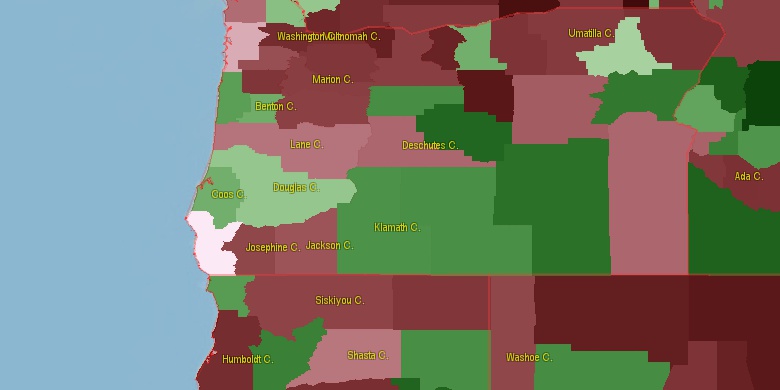
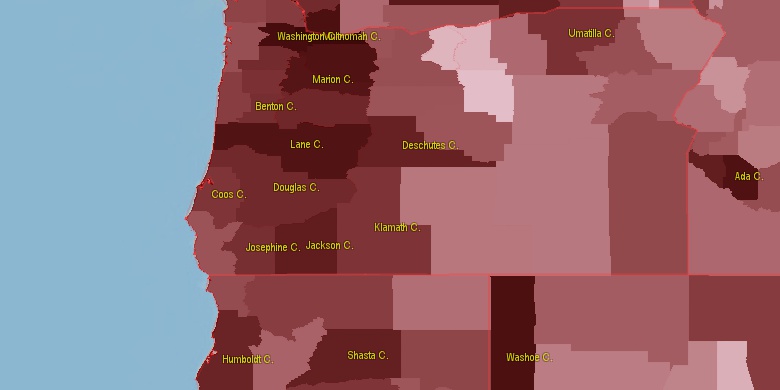
Estimated population for 2014[1]. Population density is in p./sq.mi [4]. Changes are for period 2010-2015. Value is %/year. Boundary lines are approx. 2012 [5]. Click on flag to hide it.
Population • Density • Changes • Legends • Position

[1890-1900] +2.02 %/yr
[1900-1910] +8.92 %/yr
[1910-1920] -9.52 %/yr
[1920-1930] -0.26 %/yr
[1930-1940] +5.19 %/yr
[1940-1950] +4.97 %/yr
[1950-1960] +0.48 %/yr
[1960-1970] +0.57 %/yr
[1970-1980] +2.75 %/yr
[1980-1990] +0.75 %/yr
[1990-2000] +3.11 %/yr
[2000-2005] +1.85 %/yr
[2005-2010] -0.04 %/yr
[2010-2014] -0.1 %/yr
Looking for settlements in Crook County? Visit this page: Settlements in Crook County, OR
Population of Crook County by age groups male (M) and female (F)[1b]
| Age Gr. | (M) | (F) | Total |
| 0 to 4 | 432 | 462 | 894 |
| 5 to 9 | 572 | 535 | 1,107 |
| 10 to 14 | 652 | 590 | 1,242 |
| 15 to 19 | 616 | 616 | 1,232 |
| 20 to 24 | 487 | 442 | 929 |
| 25 to 29 | 448 | 453 | 901 |
| 30 to 34 | 493 | 521 | 1,014 |
| 35 to 39 | 565 | 614 | 1,179 |
| 40 to 44 | 565 | 576 | 1,141 |
| 45 to 49 | 568 | 610 | 1,178 |
| 50 to 54 | 728 | 798 | 1,526 |
| 55 to 59 | 844 | 895 | 1,739 |
| 60 to 64 | 847 | 991 | 1,838 |
| 65 to 69 | 921 | 918 | 1,839 |
| 70 to 74 | 738 | 598 | 1,336 |
| 75 to 79 | 433 | 420 | 853 |
| 80 to 84 | 238 | 306 | 544 |
| 85+ | 218 | 288 | 506 |
Crook County resident population estimates by Sex, Race, and Hispanic Origin[1b]. For full list of abbrevations see: population.us/about page.
| Race | Male | Female | Total |
| WAC | 10101 | 10315 | 20,416 |
| WA | 9902 | 10095 | 19,997 |
| NH | 9573 | 9865 | 19,438 |
| NHWAC | 9357 | 9603 | 18,960 |
| NHWA | 9190 | 9412 | 18,602 |
| H | 792 | 768 | 1,560 |
| HWAC | 744 | 712 | 1,456 |
| HWA | 712 | 683 | 1,395 |
| IAC | 293 | 319 | 612 |
| NHIAC | 240 | 267 | 507 |
| TOM | 213 | 230 | 443 |
| NHTOM | 178 | 197 | 375 |
| IA | 151 | 177 | 328 |
| NHIA | 120 | 143 | 263 |
| AAC | 91 | 137 | 228 |
| NHAAC | 85 | 119 | 204 |
| BAC | 78 | 78 | 156 |
| AA | 54 | 95 | 149 |
| NHAA | 49 | 86 | 135 |
| NHBAC | 55 | 58 | 113 |
| HIAC | 53 | 52 | 105 |
| HTOM | 35 | 33 | 68 |
| BA | 36 | 30 | 66 |
| HIA | 31 | 34 | 65 |
| NHBA | 27 | 21 | 48 |
| HBAC | 23 | 20 | 43 |
| NAC | 19 | 20 | 39 |
| NHNAC | 18 | 17 | 35 |
| HAAC | 6 | 18 | 24 |
| HBA | 9 | 9 | 18 |
| NHNA | 9 | 6 | 15 |
| NA | 9 | 6 | 15 |
| HAA | 5 | 9 | 14 |
| HNAC | 1 | 3 | 4 |
| HNA | 0 | 0 | 0 |
• Deschutes County population
45.7 mi,  248°
248°
• Wasco County
79.4 mi,  330°
330°
• Jefferson County
51.9 mi,  309°
309°
• Morrow County
95 mi,  23°
23°
• Lake County
95 mi,  180°
180°
• Grant County
70.9 mi,  71°
71°
• Harney County
102.7 mi,  137°
137°
• Gilliam County
84.4 mi,  3°
3°
• Sherman County
86.7 mi,  350°
350°
• Wheeler County
43.1 mi, 23°
[0] Calculated by population.us from last known population growth rate, not official data.
[1] County population - 2014, archived from the original, retrieved 02/23/2016
[1b] Annual County Resident Population Estimates by Age, Sex, Race, and Hispanic Origin, (used only data for 2014) archived from the original, retrieved 02/23/2016
[2] County population - 2000-2010, archived from the original, retrieved 02/23/2016
[3] Population of States and Counties of the United States: 1790 to 1992, PDF, 15 Mb, census.gov, retrieved 02/23/2016
[4] County area, latitude longitude data, retrieved 02/23/2016
[5] County boundaries, CSV files on boundaries.us, retrived 03/18/2016
*Wasco, Grant Oregon Notes
Page generated in 0.015 seconds© 2016 population.us | Terms of use | Contact