Last official estimated population of Mineral County was 4,211 (year 2014)[1]. This was 0.001% of total US population and 0.4% of total Montana state population. Area of Mineral County is 1,223.5 mi² (=3168.7 km²), in this year population density was 3.44 p/mi². If population growth rate would be same as in period 2010-2014 (-0.07%/yr), Mineral County population in 2026 would be 4,175 [0].
Historical population of Mineral County for period 1920-2014 [1] , [2] , [3]:
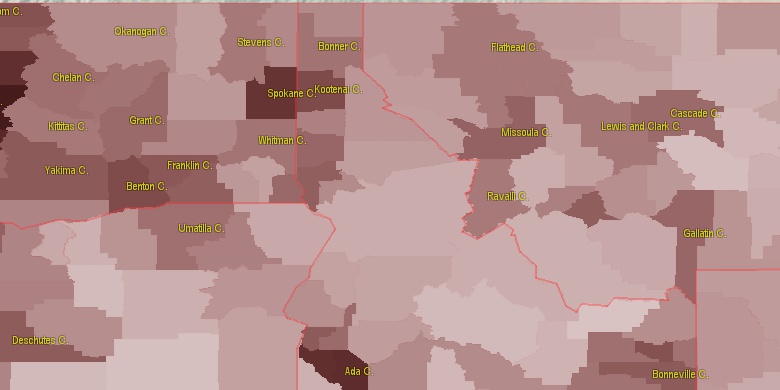
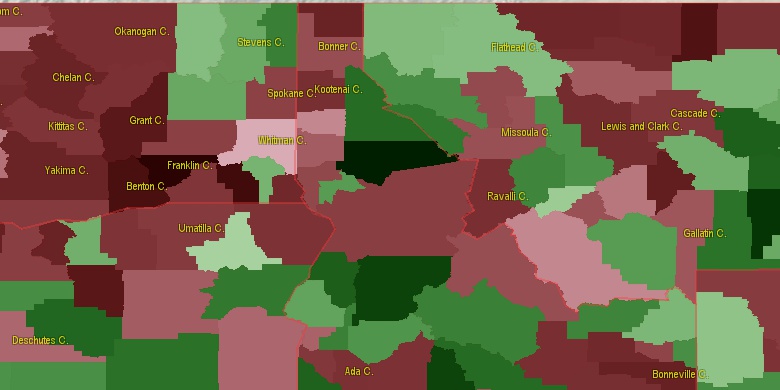
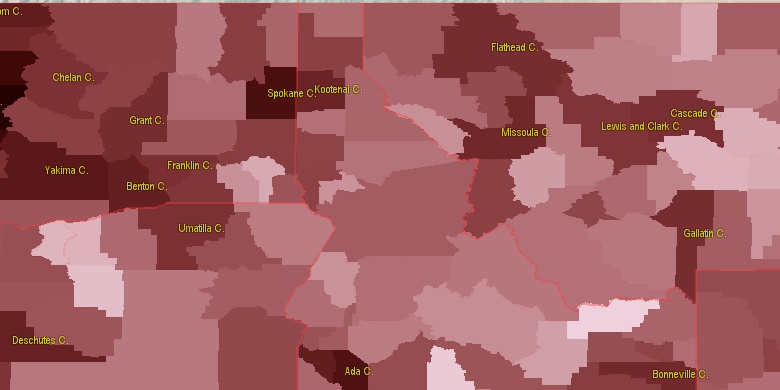
Estimated population for 2014[1]. Population density is in p./sq.mi [4]. Changes are for period 2010-2015. Value is %/year. Boundary lines are approx. 2012 [5]. Click on flag to hide it.
Population • Density • Changes • Legends • Position

[1920-1930] -3.52 %/yr
[1930-1940] +2.76 %/yr
[1940-1950] -0.26 %/yr
[1950-1960] +3.85 %/yr
[1960-1970] -0.26 %/yr
[1970-1980] +2.19 %/yr
[1980-1990] -1.03 %/yr
[1990-2000] +1.56 %/yr
[2000-2005] +1.32 %/yr
[2005-2010] +0.43 %/yr
[2010-2014] -0.07 %/yr
Looking for settlements in Mineral County? Visit this page: Settlements in Mineral County, MT
Population of Mineral County by age groups male (M) and female (F)[1b]
| Age Gr. | (M) | (F) | Total |
| 0 to 4 | 118 | 82 | 200 |
| 5 to 9 | 114 | 110 | 224 |
| 10 to 14 | 120 | 99 | 219 |
| 15 to 19 | 111 | 85 | 196 |
| 20 to 24 | 94 | 72 | 166 |
| 25 to 29 | 110 | 79 | 189 |
| 30 to 34 | 107 | 98 | 205 |
| 35 to 39 | 76 | 91 | 167 |
| 40 to 44 | 104 | 90 | 194 |
| 45 to 49 | 119 | 121 | 240 |
| 50 to 54 | 155 | 171 | 326 |
| 55 to 59 | 196 | 169 | 365 |
| 60 to 64 | 231 | 204 | 435 |
| 65 to 69 | 173 | 176 | 349 |
| 70 to 74 | 180 | 158 | 338 |
| 75 to 79 | 130 | 99 | 229 |
| 80 to 84 | 60 | 48 | 108 |
| 85+ | 46 | 61 | 107 |
Mineral County resident population estimates by Sex, Race, and Hispanic Origin[1b]. For full list of abbrevations see: population.us/about page.
| Race | Male | Female | Total |
| NH | 2184 | 1952 | 4,136 |
| WAC | 2171 | 1944 | 4,115 |
| NHWAC | 2116 | 1890 | 4,006 |
| WA | 2094 | 1894 | 3,988 |
| NHWA | 2045 | 1840 | 3,885 |
| IAC | 105 | 70 | 175 |
| NHIAC | 98 | 69 | 167 |
| TOM | 80 | 51 | 131 |
| NHTOM | 74 | 51 | 125 |
| H | 60 | 61 | 121 |
| HWAC | 55 | 54 | 109 |
| HWA | 49 | 54 | 103 |
| IA | 47 | 35 | 82 |
| NHIA | 43 | 34 | 77 |
| AAC | 21 | 29 | 50 |
| NHAAC | 19 | 29 | 48 |
| BAC | 27 | 19 | 46 |
| NHBAC | 25 | 13 | 38 |
| NHAA | 11 | 22 | 33 |
| AA | 11 | 22 | 33 |
| BA | 12 | 11 | 23 |
| NHBA | 11 | 5 | 16 |
| HIAC | 7 | 1 | 8 |
| HBAC | 2 | 6 | 8 |
| HBA | 1 | 6 | 7 |
| HTOM | 6 | 0 | 6 |
| HIA | 4 | 1 | 5 |
| NAC | 2 | 2 | 4 |
| NHNAC | 2 | 2 | 4 |
| HAAC | 2 | 0 | 2 |
| HNAC | 0 | 0 | 0 |
| NHNA | 0 | 0 | 0 |
| NA | 0 | 0 | 0 |
| HNA | 0 | 0 | 0 |
| HAA | 0 | 0 | 0 |
• Kootenai County population
84.3 mi,  295°
295°
• Missoula County
55.8 mi,  99°
99°
• Ravalli County
86.8 mi,  148°
148°
• Latah County
81.9 mi,  253°
253°
• Lake County
56.9 mi,  53°
53°
• Shoshone County
40.7 mi,  289°
289°
• Sanders County
41.9 mi,  352°
352°
• Benewah County
73.8 mi,  273°
273°
• Clearwater County
43.4 mi,  219°
219°
• Lewis County
90.4 mi,  225°
225°
[0] Calculated by population.us from last known population growth rate, not official data.
[1] County population - 2014, archived from the original, retrieved 02/23/2016
[1b] Annual County Resident Population Estimates by Age, Sex, Race, and Hispanic Origin, (used only data for 2014) archived from the original, retrieved 02/23/2016
[2] County population - 2000-2010, archived from the original, retrieved 02/23/2016
[3] Population of States and Counties of the United States: 1790 to 1992, PDF, 15 Mb, census.gov, retrieved 02/23/2016
[4] County area, latitude longitude data, retrieved 02/23/2016
[5] County boundaries, CSV files on boundaries.us, retrived 03/18/2016
*Missoula; Sanders Montana Notes
Page generated in 0.019 seconds© 2016 population.us | Terms of use | Contact