Last official estimated population of Clearwater County was 8,627 (year 2014)[1]. This was 0.003% of total US population and 0.5% of total Idaho state population. Area of Clearwater County is 2,487.9 mi² (=6443.7 km²), in this year population density was 3.47 p/mi². If population growth rate would be same as in period 2010-2014 (-0.38%/yr), Clearwater County population in 2026 would be 8,237 [0].
Historical population of Clearwater County for period 1920-2014 [1] , [2] , [3]:
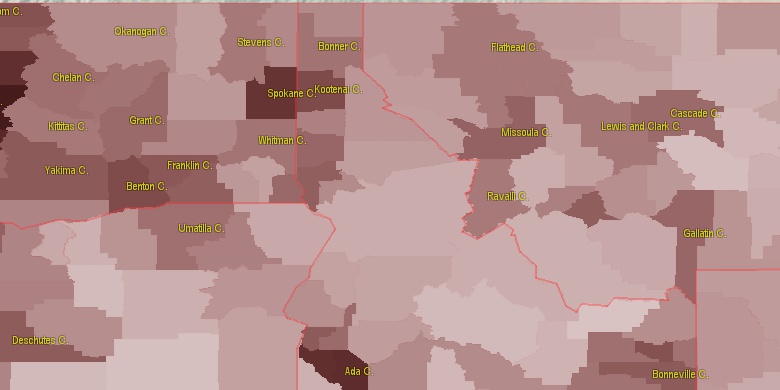
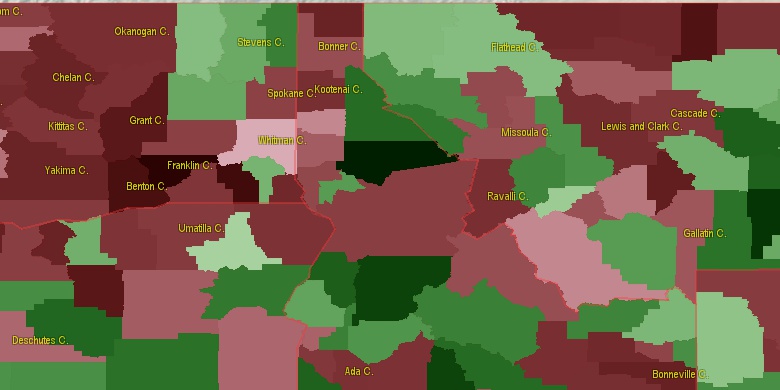
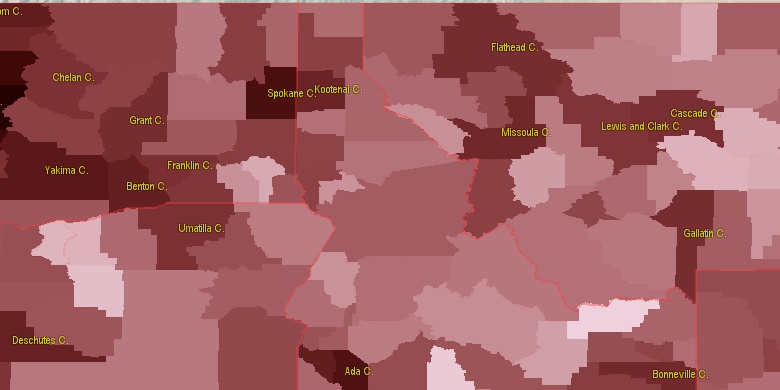
Estimated population for 2014[1]. Population density is in p./sq.mi [4]. Changes are for period 2010-2015. Value is %/year. Boundary lines are approx. 2012 [5]. Click on flag to hide it.
Population • Density • Changes • Legends • Position

[1920-1930] +2.83 %/yr
[1930-1940] +2.25 %/yr
[1940-1950] -0.03 %/yr
[1950-1960] +0.4 %/yr
[1960-1970] +2.43 %/yr
[1970-1980] -0.45 %/yr
[1980-1990] -1.98 %/yr
[1990-2000] +0.49 %/yr
[2000-2005] -0.61 %/yr
[2005-2010] +0.23 %/yr
[2010-2014] -0.38 %/yr
Looking for settlements in Clearwater County? Visit this page: Settlements in Clearwater County, ID
Population of Clearwater County by age groups male (M) and female (F)[1b]
| Age Gr. | (M) | (F) | Total |
| 0 to 4 | 151 | 188 | 339 |
| 5 to 9 | 200 | 176 | 376 |
| 10 to 14 | 218 | 175 | 393 |
| 15 to 19 | 242 | 183 | 425 |
| 20 to 24 | 271 | 138 | 409 |
| 25 to 29 | 240 | 144 | 384 |
| 30 to 34 | 265 | 161 | 426 |
| 35 to 39 | 265 | 179 | 444 |
| 40 to 44 | 258 | 185 | 443 |
| 45 to 49 | 326 | 247 | 573 |
| 50 to 54 | 374 | 349 | 723 |
| 55 to 59 | 347 | 349 | 696 |
| 60 to 64 | 397 | 360 | 757 |
| 65 to 69 | 398 | 330 | 728 |
| 70 to 74 | 340 | 242 | 582 |
| 75 to 79 | 205 | 217 | 422 |
| 80 to 84 | 111 | 115 | 226 |
| 85+ | 81 | 135 | 216 |
Clearwater County resident population estimates by Sex, Race, and Hispanic Origin[1b]. For full list of abbrevations see: population.us/about page.
| Race | Male | Female | Total |
| WAC | 4518 | 3745 | 8,263 |
| NH | 4495 | 3759 | 8,254 |
| WA | 4430 | 3655 | 8,085 |
| NHWAC | 4340 | 3642 | 7,982 |
| NHWA | 4263 | 3556 | 7,819 |
| H | 194 | 114 | 308 |
| IAC | 166 | 139 | 305 |
| HWAC | 178 | 103 | 281 |
| NHIAC | 146 | 126 | 272 |
| HWA | 167 | 99 | 266 |
| IA | 109 | 78 | 187 |
| TOM | 89 | 92 | 181 |
| NHTOM | 77 | 88 | 165 |
| NHIA | 95 | 68 | 163 |
| AAC | 39 | 42 | 81 |
| BAC | 49 | 30 | 79 |
| NHAAC | 35 | 42 | 77 |
| NHBAC | 45 | 28 | 73 |
| AA | 23 | 29 | 52 |
| NHAA | 23 | 29 | 52 |
| BA | 34 | 11 | 45 |
| NHBA | 33 | 10 | 43 |
| HIAC | 20 | 13 | 33 |
| HIA | 14 | 10 | 24 |
| NAC | 9 | 15 | 24 |
| NHNAC | 9 | 15 | 24 |
| HTOM | 12 | 4 | 16 |
| NA | 4 | 8 | 12 |
| NHNA | 4 | 8 | 12 |
| HBAC | 4 | 2 | 6 |
| HAAC | 4 | 0 | 4 |
| HBA | 1 | 1 | 2 |
| HNAC | 0 | 0 | 0 |
| HNA | 0 | 0 | 0 |
| HAA | 0 | 0 | 0 |
• Ravalli County population
83.8 mi,  119°
119°
• Nez Perce County
57.6 mi,  246°
246°
• Latah County
52 mi,  281°
281°
• Asotin County
82.3 mi, 245°
• Idaho County
57.5 mi,  171°
171°
• Shoshone County
47.9 mi,  346°
346°
• Sanders County
78.1 mi,  16°
16°
• Benewah County
59.7 mi,  309°
309°
• Mineral County
43.4 mi,  39°
39°
• Lewis County
47.5 mi,  230°
230°
[0] Calculated by population.us from last known population growth rate, not official data.
[1] County population - 2014, archived from the original, retrieved 02/23/2016
[1b] Annual County Resident Population Estimates by Age, Sex, Race, and Hispanic Origin, (used only data for 2014) archived from the original, retrieved 02/23/2016
[2] County population - 2000-2010, archived from the original, retrieved 02/23/2016
[3] Population of States and Counties of the United States: 1790 to 1992, PDF, 15 Mb, census.gov, retrieved 02/23/2016
[4] County area, latitude longitude data, retrieved 02/23/2016
[5] County boundaries, CSV files on boundaries.us, retrived 03/18/2016
*Nez Perce Idaho Notes
Page generated in 0.014 seconds© 2016 population.us | Terms of use | Contact