Last official estimated population of Benewah County was 9,287 (year 2014)[1]. This was 0.003% of total US population and 0.6% of total Idaho state population. Area of Benewah County is 783.9 mi² (=2030.4 km²), in this year population density was 11.85 p/mi². If population growth rate would be same as in period 2010-2014 (+0.01%/yr), Benewah County population in 2026 would be 9,293 [0].
Historical population of Benewah County for period 1920-2014 [1] , [2] , [3]:
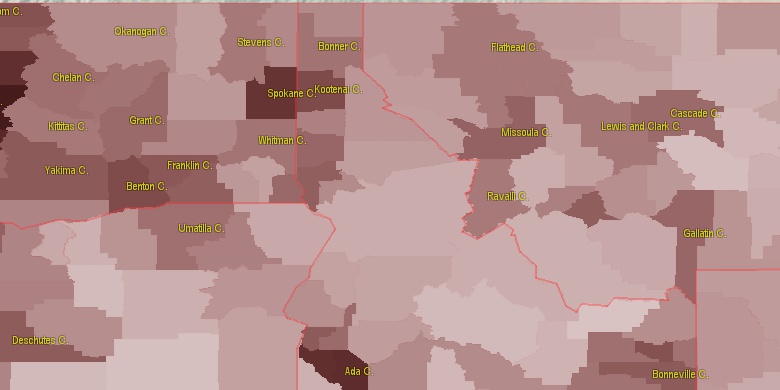
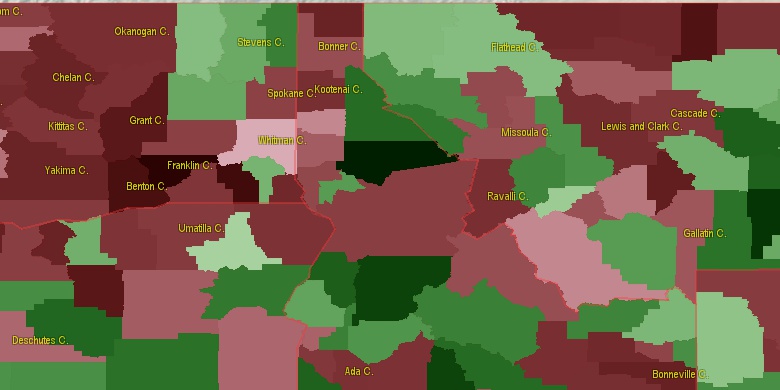
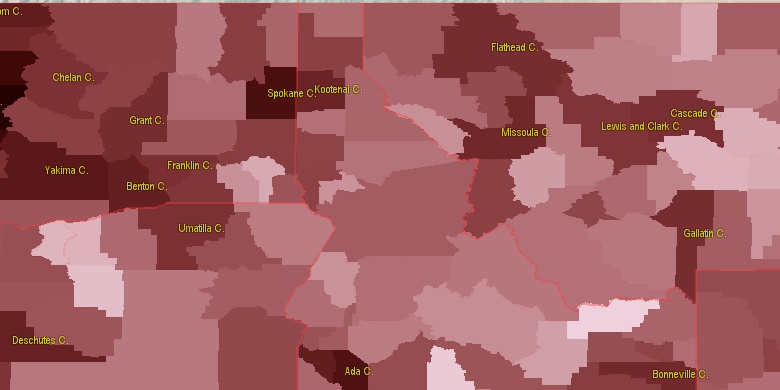
Estimated population for 2014[1]. Population density is in p./sq.mi [4]. Changes are for period 2010-2015. Value is %/year. Boundary lines are approx. 2012 [5]. Click on flag to hide it.
Population • Density • Changes • Legends • Position

[1920-1930] -0.93 %/yr
[1930-1940] +1.41 %/yr
[1940-1950] -1.71 %/yr
[1950-1960] -0.22 %/yr
[1960-1970] +0.32 %/yr
[1970-1980] +2.9 %/yr
[1980-1990] -0.44 %/yr
[1990-2000] +1.45 %/yr
[2000-2005] -0.25 %/yr
[2005-2010] +0.51 %/yr
[2010-2014] +0.01 %/yr
Looking for settlements in Benewah County? Visit this page: Settlements in Benewah County, ID
Population of Benewah County by age groups male (M) and female (F)[1b]
| Age Gr. | (M) | (F) | Total |
| 0 to 4 | 239 | 279 | 518 |
| 5 to 9 | 323 | 268 | 591 |
| 10 to 14 | 274 | 291 | 565 |
| 15 to 19 | 292 | 245 | 537 |
| 20 to 24 | 235 | 216 | 451 |
| 25 to 29 | 206 | 214 | 420 |
| 30 to 34 | 223 | 209 | 432 |
| 35 to 39 | 211 | 229 | 440 |
| 40 to 44 | 243 | 231 | 474 |
| 45 to 49 | 270 | 271 | 541 |
| 50 to 54 | 330 | 347 | 677 |
| 55 to 59 | 409 | 399 | 808 |
| 60 to 64 | 368 | 363 | 731 |
| 65 to 69 | 342 | 341 | 683 |
| 70 to 74 | 283 | 249 | 532 |
| 75 to 79 | 171 | 145 | 316 |
| 80 to 84 | 119 | 112 | 231 |
| 85+ | 66 | 105 | 171 |
Benewah County resident population estimates by Sex, Race, and Hispanic Origin[1b]. For full list of abbrevations see: population.us/about page.
| Race | Male | Female | Total |
| NH | 4435 | 4382 | 8,817 |
| WAC | 4174 | 4088 | 8,262 |
| NHWAC | 4059 | 3982 | 8,041 |
| WA | 3997 | 3897 | 7,894 |
| NHWA | 3897 | 3810 | 7,707 |
| IAC | 524 | 520 | 1,044 |
| NHIAC | 465 | 488 | 953 |
| IA | 392 | 381 | 773 |
| NHIA | 342 | 357 | 699 |
| TOM | 177 | 197 | 374 |
| NHTOM | 162 | 178 | 340 |
| H | 169 | 132 | 301 |
| HWAC | 115 | 106 | 221 |
| HWA | 100 | 87 | 187 |
| HIAC | 59 | 32 | 91 |
| AAC | 35 | 50 | 85 |
| BAC | 41 | 42 | 83 |
| NHAAC | 33 | 46 | 79 |
| HIA | 50 | 24 | 74 |
| NHBAC | 33 | 35 | 68 |
| AA | 11 | 24 | 35 |
| BA | 22 | 12 | 34 |
| HTOM | 15 | 19 | 34 |
| NHAA | 10 | 24 | 34 |
| NHBA | 19 | 10 | 29 |
| NAC | 9 | 17 | 26 |
| NHNAC | 9 | 15 | 24 |
| HBAC | 8 | 7 | 15 |
| NHNA | 5 | 3 | 8 |
| NA | 5 | 3 | 8 |
| HAAC | 2 | 4 | 6 |
| HBA | 3 | 2 | 5 |
| HNAC | 0 | 2 | 2 |
| HAA | 1 | 0 | 1 |
| HNA | 0 | 0 | 0 |
• Spokane County population
45.5 mi,  307°
307°
• Kootenai County
31.8 mi,  354°
354°
• Whitman County
47.6 mi,  243°
243°
• Nez Perce County
61.4 mi,  185°
185°
• Latah County
28 mi, 189°
• Shoshone County
36.2 mi,  75°
75°
• Clearwater County
59.7 mi,  129°
129°
• Mineral County
73.8 mi,  93°
93°
• Lewis County
68.6 mi,  171°
171°
• Garfield County
69.2 mi,  218°
218°
[0] Calculated by population.us from last known population growth rate, not official data.
[1] County population - 2014, archived from the original, retrieved 02/23/2016
[1b] Annual County Resident Population Estimates by Age, Sex, Race, and Hispanic Origin, (used only data for 2014) archived from the original, retrieved 02/23/2016
[2] County population - 2000-2010, archived from the original, retrieved 02/23/2016
[3] Population of States and Counties of the United States: 1790 to 1992, PDF, 15 Mb, census.gov, retrieved 02/23/2016
[4] County area, latitude longitude data, retrieved 02/23/2016
[5] County boundaries, CSV files on boundaries.us, retrived 03/18/2016
*Kootenai Idaho Notes
Page generated in 0.015 seconds© 2016 population.us | Terms of use | Contact