Last official estimated population of Grenada County was 21,872 (year 2014)[1]. This was 0.007% of total US population and 0.7% of total Mississippi state population. Area of Grenada County is 449.4 mi² (=1164 km²), in this year population density was 48.67 p/mi². If population growth rate would be same as in period 2010-2014 (-0.04%/yr), Grenada County population in 2026 would be 21,770 [0].
Historical population of Grenada County for period 1870-2014 [1] , [2] , [3]:
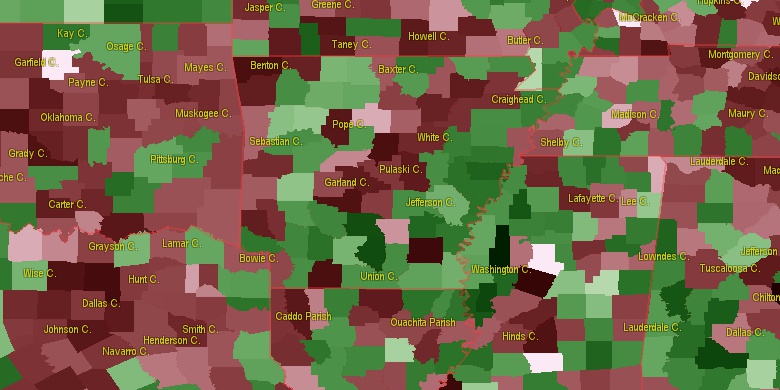
Estimated population for 2014[1]. Population density is in p./sq.mi [4]. Changes are for period 2010-2015. Value is %/year. Boundary lines are approx. 2012 [5]. Click on flag to hide it.
Population • Density • Changes • Legends • Position


[1870-1880] +1.34 %/yr
[1880-1890] +2.18 %/yr
[1890-1900] -0.59 %/yr
[1900-1910] +1.09 %/yr
[1910-1920] -1.44 %/yr
[1920-1930] +2.13 %/yr
[1930-1940] +1.26 %/yr
[1940-1950] -0.12 %/yr
[1950-1960] -0.23 %/yr
[1960-1970] +0.76 %/yr
[1970-1980] +0.58 %/yr
[1980-1990] +0.24 %/yr
[1990-2000] +0.77 %/yr
[2000-2005] -0.96 %/yr
[2005-2010] -0.24 %/yr
[2010-2014] -0.04 %/yr
Looking for settlements in Grenada County? Visit this page: Settlements in Grenada County, MS
Population of Grenada County by age groups male (M) and female (F)[1b]
| Age Gr. | (M) | (F) | Total |
| 0 to 4 | 668 | 682 | 1,350 |
| 5 to 9 | 777 | 710 | 1,487 |
| 10 to 14 | 728 | 693 | 1,421 |
| 15 to 19 | 721 | 680 | 1,401 |
| 20 to 24 | 707 | 770 | 1,477 |
| 25 to 29 | 573 | 661 | 1,234 |
| 30 to 34 | 576 | 680 | 1,256 |
| 35 to 39 | 599 | 688 | 1,287 |
| 40 to 44 | 618 | 730 | 1,348 |
| 45 to 49 | 669 | 758 | 1,427 |
| 50 to 54 | 725 | 798 | 1,523 |
| 55 to 59 | 735 | 779 | 1,514 |
| 60 to 64 | 633 | 719 | 1,352 |
| 65 to 69 | 571 | 620 | 1,191 |
| 70 to 74 | 377 | 507 | 884 |
| 75 to 79 | 281 | 377 | 658 |
| 80 to 84 | 161 | 267 | 428 |
| 85+ | 130 | 298 | 428 |
Grenada County resident population estimates by Sex, Race, and Hispanic Origin[1b]. For full list of abbrevations see: population.us/about page.
| Race | Male | Female | Total |
| NH | 10110 | 11303 | 21,413 |
| WAC | 5923 | 6372 | 12,295 |
| WA | 5855 | 6279 | 12,134 |
| NHWAC | 5810 | 6288 | 12,098 |
| NHWA | 5748 | 6205 | 11,953 |
| BAC | 4296 | 5020 | 9,316 |
| NHBAC | 4270 | 4990 | 9,260 |
| BA | 4251 | 4942 | 9,193 |
| NHBA | 4229 | 4918 | 9,147 |
| H | 139 | 114 | 253 |
| TOM | 81 | 118 | 199 |
| HWAC | 113 | 84 | 197 |
| NHTOM | 75 | 107 | 182 |
| HWA | 107 | 74 | 181 |
| AAC | 49 | 76 | 125 |
| IAC | 57 | 67 | 124 |
| NHAAC | 48 | 75 | 123 |
| NHIAC | 53 | 58 | 111 |
| AA | 42 | 54 | 96 |
| NHAA | 41 | 53 | 94 |
| HBAC | 26 | 30 | 56 |
| HBA | 22 | 24 | 46 |
| IA | 19 | 23 | 42 |
| NHIA | 17 | 19 | 36 |
| HTOM | 6 | 11 | 17 |
| HIAC | 4 | 9 | 13 |
| NAC | 5 | 4 | 9 |
| NHNAC | 4 | 2 | 6 |
| HIA | 2 | 4 | 6 |
| HNAC | 1 | 2 | 3 |
| NA | 1 | 1 | 2 |
| HAAC | 1 | 1 | 2 |
| HAA | 1 | 1 | 2 |
| HNA | 1 | 0 | 1 |
| NHNA | 0 | 1 | 1 |
• Panola County population
42.1 mi,  347°
347°
• Leflore County
32.1 mi,  241°
241°
• Tallahatchie County
24.7 mi,  301°
301°
• Calhoun County
29.1 mi,  66°
66°
• Yalobusha County
18.9 mi,  17°
17°
• Montgomery County
20.8 mi,  153°
153°
• Carroll County
23.7 mi,  196°
196°
• Webster County
31.8 mi,  110°
110°
• Choctaw County
43.2 mi,  132°
132°
• Quitman County
43.5 mi,  320°
320°
[0] Calculated by population.us from last known population growth rate, not official data.
[1] County population - 2014, archived from the original, retrieved 02/23/2016
[1b] Annual County Resident Population Estimates by Age, Sex, Race, and Hispanic Origin, (used only data for 2014) archived from the original, retrieved 02/23/2016
[2] County population - 2000-2010, archived from the original, retrieved 02/23/2016
[3] Population of States and Counties of the United States: 1790 to 1992, PDF, 15 Mb, census.gov, retrieved 02/23/2016
[4] County area, latitude longitude data, retrieved 02/23/2016
[5] County boundaries, CSV files on boundaries.us, retrived 03/18/2016
See note 4 Mississippi Notes
Page generated in 0.015 seconds© 2016 population.us | Terms of use | Contact