Last official estimated population of Montgomery County was 10,906 (year 2014)[1]. This was 0.003% of total US population and 0.4% of total Mississippi state population. Area of Montgomery County is 407.9 mi² (=1056.4 km²), in this year population density was 26.74 p/mi². If population growth rate would be same as in period 2010-2014 (-0.04%/yr), Montgomery County population in 2026 would be 10,849 [0].
Historical population of Montgomery County for period 1880-2014 [1] , [2] , [3]:
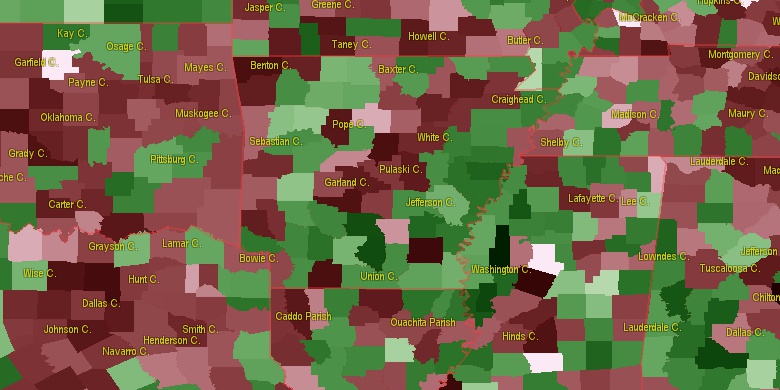
Estimated population for 2014[1]. Population density is in p./sq.mi [4]. Changes are for period 2010-2015. Value is %/year. Boundary lines are approx. 2012 [5]. Click on flag to hide it.
Population • Density • Changes • Legends • Position


[1880-1890] +0.8 %/yr
[1890-1900] +1.35 %/yr
[1900-1910] +0.69 %/yr
[1910-1920] -2.46 %/yr
[1920-1930] +0.84 %/yr
[1930-1940] +0.45 %/yr
[1940-1950] -0.81 %/yr
[1950-1960] -0.82 %/yr
[1960-1970] -0.31 %/yr
[1970-1980] +0.34 %/yr
[1980-1990] -0.76 %/yr
[1990-2000] -0.16 %/yr
[2000-2005] -1.2 %/yr
[2005-2010] -0.98 %/yr
[2010-2014] -0.04 %/yr
Looking for settlements in Montgomery County? Visit this page: Settlements in Montgomery County, MS
Population of Montgomery County by age groups male (M) and female (F)[1b]
| Age Gr. | (M) | (F) | Total |
| 0 to 4 | 330 | 314 | 644 |
| 5 to 9 | 375 | 343 | 718 |
| 10 to 14 | 317 | 307 | 624 |
| 15 to 19 | 313 | 287 | 600 |
| 20 to 24 | 336 | 337 | 673 |
| 25 to 29 | 248 | 288 | 536 |
| 30 to 34 | 261 | 292 | 553 |
| 35 to 39 | 252 | 265 | 517 |
| 40 to 44 | 253 | 320 | 573 |
| 45 to 49 | 330 | 360 | 690 |
| 50 to 54 | 373 | 424 | 797 |
| 55 to 59 | 356 | 402 | 758 |
| 60 to 64 | 370 | 370 | 740 |
| 65 to 69 | 313 | 345 | 658 |
| 70 to 74 | 239 | 245 | 484 |
| 75 to 79 | 141 | 206 | 347 |
| 80 to 84 | 87 | 152 | 239 |
| 85+ | 78 | 171 | 249 |
Montgomery County resident population estimates by Sex, Race, and Hispanic Origin[1b]. For full list of abbrevations see: population.us/about page.
| Race | Male | Female | Total |
| NH | 4904 | 5376 | 10,280 |
| WAC | 2744 | 2857 | 5,601 |
| WA | 2710 | 2827 | 5,537 |
| NHWAC | 2696 | 2816 | 5,512 |
| NHWA | 2663 | 2786 | 5,449 |
| BAC | 2216 | 2561 | 4,777 |
| NHBAC | 2196 | 2550 | 4,746 |
| BA | 2194 | 2536 | 4,730 |
| NHBA | 2175 | 2525 | 4,700 |
| H | 68 | 52 | 120 |
| HWAC | 48 | 41 | 89 |
| HWA | 47 | 41 | 88 |
| TOM | 38 | 37 | 75 |
| NHTOM | 36 | 37 | 73 |
| AAC | 28 | 22 | 50 |
| NHAAC | 26 | 22 | 48 |
| NHIAC | 23 | 25 | 48 |
| IAC | 23 | 25 | 48 |
| AA | 17 | 19 | 36 |
| NHAA | 17 | 19 | 36 |
| HBAC | 20 | 11 | 31 |
| HBA | 19 | 11 | 30 |
| IA | 13 | 8 | 21 |
| NHIA | 13 | 8 | 21 |
| NAC | 2 | 1 | 3 |
| HTOM | 2 | 0 | 2 |
| HAAC | 2 | 0 | 2 |
| NHNAC | 1 | 1 | 2 |
| HNAC | 1 | 0 | 1 |
| NA | 0 | 1 | 1 |
| NHNA | 0 | 1 | 1 |
| HIA | 0 | 0 | 0 |
| HNA | 0 | 0 | 0 |
| HAA | 0 | 0 | 0 |
| HIAC | 0 | 0 | 0 |
• Leflore County population
37.9 mi,  275°
275°
• Grenada County
20.8 mi,  333°
333°
• Attala County
28.5 mi,  174°
174°
• Holmes County
36.7 mi,  225°
225°
• Tallahatchie County
43.8 mi,  315°
315°
• Calhoun County
34.8 mi,  29°
29°
• Yalobusha County
36.8 mi,  354°
354°
• Carroll County
16.6 mi,  255°
255°
• Webster County
21.9 mi,  69°
69°
• Choctaw County
24.8 mi,  115°
115°
[0] Calculated by population.us from last known population growth rate, not official data.
[1] County population - 2014, archived from the original, retrieved 02/23/2016
[1b] Annual County Resident Population Estimates by Age, Sex, Race, and Hispanic Origin, (used only data for 2014) archived from the original, retrieved 02/23/2016
[2] County population - 2000-2010, archived from the original, retrieved 02/23/2016
[3] Population of States and Counties of the United States: 1790 to 1992, PDF, 15 Mb, census.gov, retrieved 02/23/2016
[4] County area, latitude longitude data, retrieved 02/23/2016
[5] County boundaries, CSV files on boundaries.us, retrived 03/18/2016
*Choctaw, Carroll Mississippi Notes
Page generated in 0.018 seconds© 2016 population.us | Terms of use | Contact