Last official estimated population of Leflore County was 32,331 (year 2014)[1]. This was 0.01% of total US population and 1.1% of total Mississippi state population. Area of Leflore County is 606.4 mi² (=1570.5 km²), in this year population density was 53.32 p/mi². If population growth rate would be same as in period 2010-2014 (+0.01%/yr), Leflore County population in 2026 would be 32,373 [0].
Historical population of Leflore County for period 1880-2014 [1] , [2] , [3]:
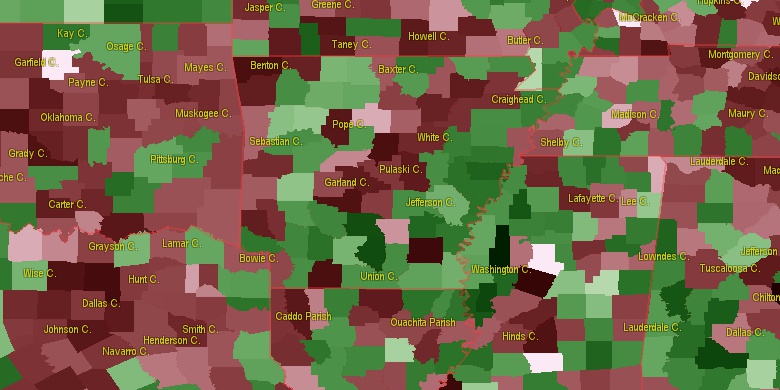
Estimated population for 2014[1]. Population density is in p./sq.mi [4]. Changes are for period 2010-2015. Value is %/year. Boundary lines are approx. 2012 [5]. Click on flag to hide it.
Population • Density • Changes • Legends • Position


[1880-1890] +5.11 %/yr
[1890-1900] +3.52 %/yr
[1900-1910] +4.29 %/yr
[1910-1920] +0.26 %/yr
[1920-1930] +3.69 %/yr
[1930-1940] -0.02 %/yr
[1940-1950] -0.3 %/yr
[1950-1960] -0.94 %/yr
[1960-1970] -1.12 %/yr
[1970-1980] -0.14 %/yr
[1980-1990] -1.06 %/yr
[1990-2000] +0.16 %/yr
[2000-2005] -2.07 %/yr
[2005-2010] -1.11 %/yr
[2010-2014] +0.01 %/yr
Looking for settlements in Leflore County? Visit this page: Settlements in Leflore County, MS
Population of Leflore County by age groups male (M) and female (F)[1b]
| Age Gr. | (M) | (F) | Total |
| 0 to 4 | 1197 | 1126 | 2,323 |
| 5 to 9 | 1339 | 1226 | 2,565 |
| 10 to 14 | 1145 | 1120 | 2,265 |
| 15 to 19 | 1153 | 1166 | 2,319 |
| 20 to 24 | 1323 | 1332 | 2,655 |
| 25 to 29 | 1128 | 1069 | 2,197 |
| 30 to 34 | 1025 | 1057 | 2,082 |
| 35 to 39 | 978 | 968 | 1,946 |
| 40 to 44 | 808 | 943 | 1,751 |
| 45 to 49 | 819 | 906 | 1,725 |
| 50 to 54 | 925 | 1025 | 1,950 |
| 55 to 59 | 901 | 1095 | 1,996 |
| 60 to 64 | 775 | 923 | 1,698 |
| 65 to 69 | 573 | 641 | 1,214 |
| 70 to 74 | 382 | 549 | 931 |
| 75 to 79 | 276 | 408 | 684 |
| 80 to 84 | 167 | 348 | 515 |
| 85+ | 189 | 417 | 606 |
Leflore County resident population estimates by Sex, Race, and Hispanic Origin[1b]. For full list of abbrevations see: population.us/about page.
| Race | Male | Female | Total |
| NH | 14657 | 15974 | 30,631 |
| BAC | 10880 | 12112 | 22,992 |
| BA | 10826 | 12027 | 22,853 |
| NHBAC | 10766 | 12010 | 22,776 |
| NHBA | 10721 | 11935 | 22,656 |
| WAC | 4074 | 4126 | 8,200 |
| WA | 3992 | 4011 | 8,003 |
| NHWAC | 3798 | 3904 | 7,702 |
| NHWA | 3736 | 3811 | 7,547 |
| H | 446 | 345 | 791 |
| HWAC | 276 | 222 | 498 |
| HWA | 256 | 200 | 456 |
| AAC | 130 | 116 | 246 |
| TOM | 97 | 138 | 235 |
| NHAAC | 122 | 107 | 229 |
| IAC | 118 | 109 | 227 |
| HBAC | 114 | 102 | 216 |
| AA | 110 | 96 | 206 |
| NHAA | 108 | 96 | 204 |
| HBA | 105 | 92 | 197 |
| NHTOM | 73 | 114 | 187 |
| IA | 76 | 47 | 123 |
| HIAC | 73 | 41 | 114 |
| NHIAC | 45 | 68 | 113 |
| HIA | 59 | 29 | 88 |
| HTOM | 24 | 24 | 48 |
| NHIA | 17 | 18 | 35 |
| HAAC | 8 | 9 | 17 |
| NAC | 8 | 4 | 12 |
| NHNAC | 4 | 3 | 7 |
| HNAC | 4 | 1 | 5 |
| NHNA | 2 | 0 | 2 |
| NA | 2 | 0 | 2 |
| HAA | 2 | 0 | 2 |
| HNA | 0 | 0 | 0 |
• Washington County population
42.1 mi,  242°
242°
• Bolivar County
38 mi,  296°
296°
• Sunflower County
17.7 mi,  282°
282°
• Grenada County
32.1 mi,  61°
61°
• Holmes County
31.6 mi,  158°
158°
• Tallahatchie County
28.8 mi,  14°
14°
• Yalobusha County
47.5 mi,  45°
45°
• Montgomery County
37.9 mi,  95°
95°
• Carroll County
22.9 mi,  109°
109°
• Humphreys County
31.8 mi,  204°
204°
[0] Calculated by population.us from last known population growth rate, not official data.
[1] County population - 2014, archived from the original, retrieved 02/23/2016
[1b] Annual County Resident Population Estimates by Age, Sex, Race, and Hispanic Origin, (used only data for 2014) archived from the original, retrieved 02/23/2016
[2] County population - 2000-2010, archived from the original, retrieved 02/23/2016
[3] Population of States and Counties of the United States: 1790 to 1992, PDF, 15 Mb, census.gov, retrieved 02/23/2016
[4] County area, latitude longitude data, retrieved 02/23/2016
[5] County boundaries, CSV files on boundaries.us, retrived 03/18/2016
*Sunflower, Carroll Mississippi Notes
Page generated in 0.017 seconds© 2016 population.us | Terms of use | Contact