Last official estimated population of Panola County was 34,670 (year 2014)[1]. This was 0.011% of total US population and 1.2% of total Mississippi state population. Area of Panola County is 705.1 mi² (=1826.3 km²), in this year population density was 49.17 p/mi². If population growth rate would be same as in period 2010-2014 (-0.03%/yr), Panola County population in 2026 would be 34,559 [0].
Historical population of Panola County for period 1840-2014 [1] , [2] , [3]:
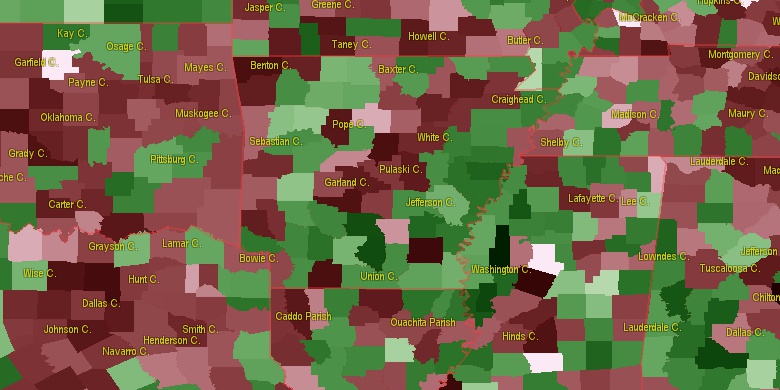
Estimated population for 2014[1]. Population density is in p./sq.mi [4]. Changes are for period 2010-2015. Value is %/year. Boundary lines are approx. 2012 [5]. Click on flag to hide it.
Population • Density • Changes • Legends • Position


[1840-1850] +9.41 %/yr
[1850-1860] +1.89 %/yr
[1860-1870] +4.17 %/yr
[1870-1880] +3.17 %/yr
[1880-1890] -0.5 %/yr
[1890-1900] +0.74 %/yr
[1900-1910] +0.75 %/yr
[1910-1920] -1.15 %/yr
[1920-1930] +0.28 %/yr
[1930-1940] +1.85 %/yr
[1940-1950] -0.96 %/yr
[1950-1960] -0.82 %/yr
[1960-1970] -0.7 %/yr
[1970-1980] +0.49 %/yr
[1980-1990] +0.63 %/yr
[1990-2000] +1.34 %/yr
[2000-2005] +0.23 %/yr
[2005-2010] +0.01 %/yr
[2010-2014] -0.03 %/yr
Looking for settlements in Panola County? Visit this page: Settlements in Panola County, MS
Population of Panola County by age groups male (M) and female (F)[1b]
| Age Gr. | (M) | (F) | Total |
| 0 to 4 | 1283 | 1201 | 2,484 |
| 5 to 9 | 1301 | 1184 | 2,485 |
| 10 to 14 | 1265 | 1183 | 2,448 |
| 15 to 19 | 1211 | 1152 | 2,363 |
| 20 to 24 | 1205 | 1234 | 2,439 |
| 25 to 29 | 1002 | 1133 | 2,135 |
| 30 to 34 | 996 | 1109 | 2,105 |
| 35 to 39 | 887 | 1074 | 1,961 |
| 40 to 44 | 1010 | 1078 | 2,088 |
| 45 to 49 | 995 | 1172 | 2,167 |
| 50 to 54 | 1181 | 1253 | 2,434 |
| 55 to 59 | 1175 | 1225 | 2,400 |
| 60 to 64 | 979 | 1065 | 2,044 |
| 65 to 69 | 780 | 897 | 1,677 |
| 70 to 74 | 552 | 696 | 1,248 |
| 75 to 79 | 376 | 488 | 864 |
| 80 to 84 | 221 | 360 | 581 |
| 85+ | 203 | 318 | 521 |
Panola County resident population estimates by Sex, Race, and Hispanic Origin[1b]. For full list of abbrevations see: population.us/about page.
| Race | Male | Female | Total |
| NH | 16294 | 17538 | 33,832 |
| BAC | 8140 | 9196 | 17,336 |
| NHBAC | 8070 | 9129 | 17,199 |
| BA | 8042 | 9082 | 17,124 |
| WAC | 8475 | 8596 | 17,071 |
| NHBA | 7979 | 9024 | 17,003 |
| WA | 8329 | 8448 | 16,777 |
| NHWAC | 8229 | 8386 | 16,615 |
| NHWA | 8098 | 8248 | 16,346 |
| H | 328 | 284 | 612 |
| HWAC | 246 | 210 | 456 |
| HWA | 231 | 200 | 431 |
| TOM | 169 | 189 | 358 |
| NHTOM | 151 | 174 | 325 |
| IAC | 113 | 117 | 230 |
| NHIAC | 89 | 103 | 192 |
| AAC | 65 | 93 | 158 |
| NHAAC | 57 | 87 | 144 |
| HBAC | 70 | 67 | 137 |
| HBA | 63 | 58 | 121 |
| IA | 46 | 51 | 97 |
| AA | 35 | 49 | 84 |
| NHIA | 34 | 44 | 78 |
| NHAA | 31 | 46 | 77 |
| HIAC | 24 | 14 | 38 |
| NAC | 15 | 19 | 34 |
| HTOM | 18 | 15 | 33 |
| NHNAC | 11 | 16 | 27 |
| HIA | 12 | 7 | 19 |
| HAAC | 8 | 6 | 14 |
| HNAC | 4 | 3 | 7 |
| HAA | 4 | 3 | 7 |
| NA | 1 | 3 | 4 |
| NHNA | 1 | 2 | 3 |
| HNA | 0 | 1 | 1 |
• DeSoto County population
35.2 mi,  357°
357°
• Lafayette County
27.2 mi,  92°
92°
• Marshall County
38.1 mi,  43°
43°
• Tate County
19.7 mi,  3°
3°
• Coahoma County
37.7 mi,  255°
255°
• Grenada County
42.1 mi,  167°
167°
• Tallahatchie County
30.8 mi,  202°
202°
• Yalobusha County
27.5 mi,  147°
147°
• Tunica County
30.6 mi,  310°
310°
• Quitman County
20.2 mi,  247°
247°
[0] Calculated by population.us from last known population growth rate, not official data.
[1] County population - 2014, archived from the original, retrieved 02/23/2016
[1b] Annual County Resident Population Estimates by Age, Sex, Race, and Hispanic Origin, (used only data for 2014) archived from the original, retrieved 02/23/2016
[2] County population - 2000-2010, archived from the original, retrieved 02/23/2016
[3] Population of States and Counties of the United States: 1790 to 1992, PDF, 15 Mb, census.gov, retrieved 02/23/2016
[4] County area, latitude longitude data, retrieved 02/23/2016
[5] County boundaries, CSV files on boundaries.us, retrived 03/18/2016
Page generated in 0.014 seconds© 2016 population.us | Terms of use | Contact