Last official estimated population of La Paz County was 20,446 (year 2014)[1]. This was 0.006% of total US population and 0.3% of total Arizona state population. Area of La Paz County is 4,513.8 mi² (=11690.6 km²), in this year population density was 4.53 p/mi². If population growth rate would be same as in period 2010-2014 (-0.05%/yr), La Paz County population in 2026 would be 20,318 [0].
Historical population of La Paz County for period 1990-2014 [1] , [2] , [3]:
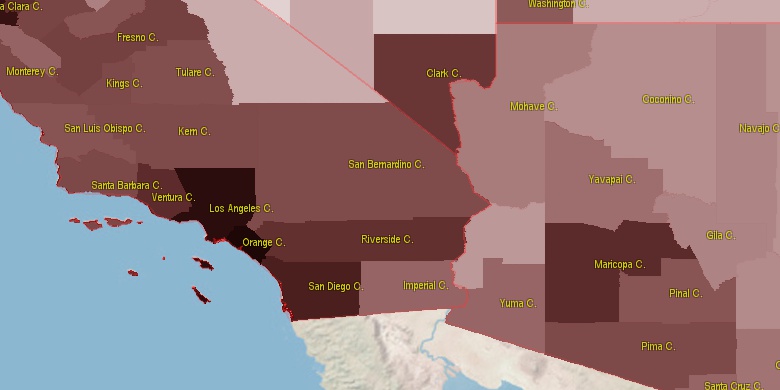
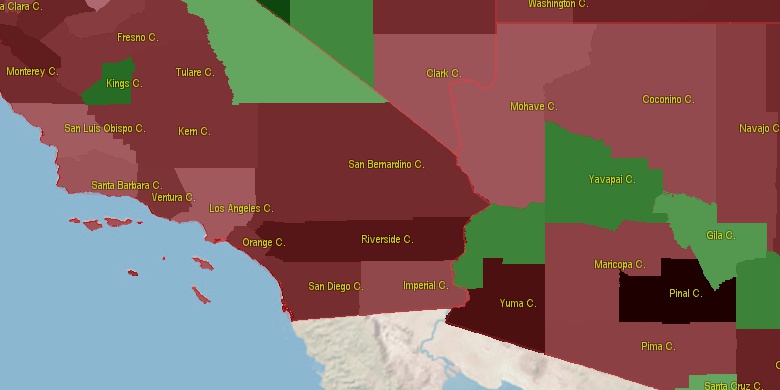
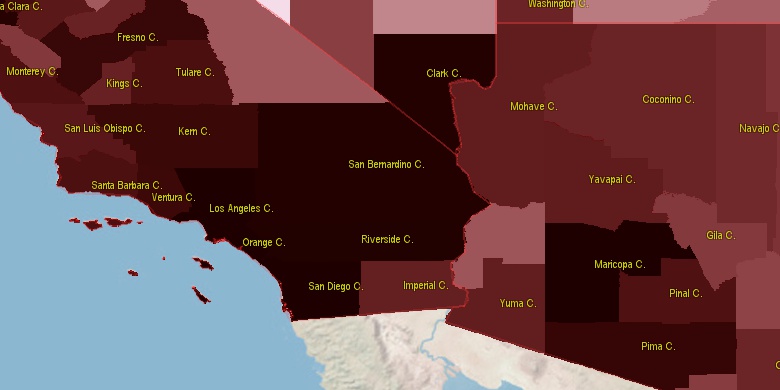
Estimated population for 2014[1]. Population density is in p./sq.mi [4]. Changes are for period 2010-2015. Value is %/year. Boundary lines are approx. 2012 [5]. Click on flag to hide it.
Population • Density • Changes • Legends • Position

[1990-2000] +3.57 %/yr
[2000-2005] +0.71 %/yr
[2005-2010] +0.11 %/yr
[2010-2014] -0.05 %/yr
Looking for settlements in La Paz County? Visit this page: Settlements in La Paz County, AZ
Population of La Paz County by age groups male (M) and female (F)[1b]
| Age Gr. | (M) | (F) | Total |
| 0 to 4 | 491 | 431 | 922 |
| 5 to 9 | 559 | 507 | 1,066 |
| 10 to 14 | 498 | 458 | 956 |
| 15 to 19 | 488 | 460 | 948 |
| 20 to 24 | 495 | 420 | 915 |
| 25 to 29 | 449 | 382 | 831 |
| 30 to 34 | 450 | 386 | 836 |
| 35 to 39 | 374 | 358 | 732 |
| 40 to 44 | 403 | 386 | 789 |
| 45 to 49 | 450 | 454 | 904 |
| 50 to 54 | 549 | 649 | 1,198 |
| 55 to 59 | 638 | 705 | 1,343 |
| 60 to 64 | 705 | 788 | 1,493 |
| 65 to 69 | 981 | 938 | 1,919 |
| 70 to 74 | 1016 | 1024 | 2,040 |
| 75 to 79 | 913 | 759 | 1,672 |
| 80 to 84 | 613 | 463 | 1,076 |
| 85+ | 275 | 316 | 591 |
La Paz County resident population estimates by Sex, Race, and Hispanic Origin[1b]. For full list of abbrevations see: population.us/about page.
| Race | Male | Female | Total |
| WAC | 8345 | 7792 | 16,137 |
| WA | 8081 | 7510 | 15,591 |
| NH | 7581 | 7455 | 15,036 |
| NHWAC | 6331 | 6036 | 12,367 |
| NHWA | 6158 | 5832 | 11,990 |
| H | 2766 | 2429 | 5,195 |
| IAC | 1948 | 2063 | 4,011 |
| HWAC | 2014 | 1756 | 3,770 |
| IA | 1752 | 1853 | 3,605 |
| HWA | 1923 | 1678 | 3,601 |
| NHIAC | 1190 | 1402 | 2,592 |
| NHIA | 1062 | 1246 | 2,308 |
| HIAC | 758 | 661 | 1,419 |
| HIA | 690 | 607 | 1,297 |
| TOM | 287 | 299 | 586 |
| NHTOM | 191 | 220 | 411 |
| BAC | 207 | 189 | 396 |
| NHBAC | 156 | 137 | 293 |
| BA | 135 | 115 | 250 |
| AAC | 117 | 122 | 239 |
| NHBA | 108 | 83 | 191 |
| HTOM | 96 | 79 | 175 |
| NHAAC | 84 | 91 | 175 |
| AA | 77 | 97 | 174 |
| NHAA | 54 | 69 | 123 |
| HBAC | 51 | 52 | 103 |
| HAAC | 33 | 31 | 64 |
| HBA | 27 | 32 | 59 |
| HAA | 23 | 28 | 51 |
| NAC | 24 | 20 | 44 |
| NHNAC | 17 | 12 | 29 |
| NA | 15 | 10 | 25 |
| HNAC | 7 | 8 | 15 |
| NHNA | 8 | 5 | 13 |
| HNA | 7 | 5 | 12 |
• Maricopa County population
92.7 mi,  106°
106°
• San Diego County
165.2 mi,  252°
252°
• Riverside County
112.8 mi,  270°
270°
• San Bernardino County
145.1 mi,  302°
302°
• Pima County
171.2 mi,  130°
130°
• Pinal County
164 mi, 109°
• Yavapai County
104.3 mi,  53°
53°
• Mohave County
138.5 mi,  6°
6°
• Yuma County
66.3 mi,  173°
173°
• Imperial County
89.6 mi,  238°
238°
[0] Calculated by population.us from last known population growth rate, not official data.
[1] County population - 2014, archived from the original, retrieved 02/23/2016
[1b] Annual County Resident Population Estimates by Age, Sex, Race, and Hispanic Origin, (used only data for 2014) archived from the original, retrieved 02/23/2016
[2] County population - 2000-2010, archived from the original, retrieved 02/23/2016
[3] Population of States and Counties of the United States: 1790 to 1992, PDF, 15 Mb, census.gov, retrieved 02/23/2016
[4] County area, latitude longitude data, retrieved 02/23/2016
[5] County boundaries, CSV files on boundaries.us, retrived 03/18/2016
*Yuma Arizona Notes
Page generated in 0.011 seconds© 2016 population.us | Terms of use | Contact