Last official estimated population of Box Elder County was 50,153 (year 2014)[1]. This was 0.016% of total US population and 1.7% of total Utah state population. Area of Box Elder County is 6,729.2 mi² (=17428.6 km²), in this year population density was 7.45 p/mi². If population growth rate would be same as in period 2010-2014 (+0.09%/yr), Box Elder County population in 2026 would be 50,691 [0].
Historical population of Box Elder County for period 1860-2014 [1] , [2] , [3]:
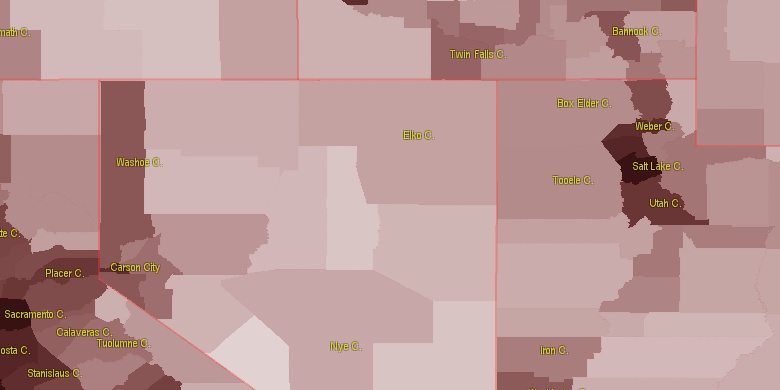
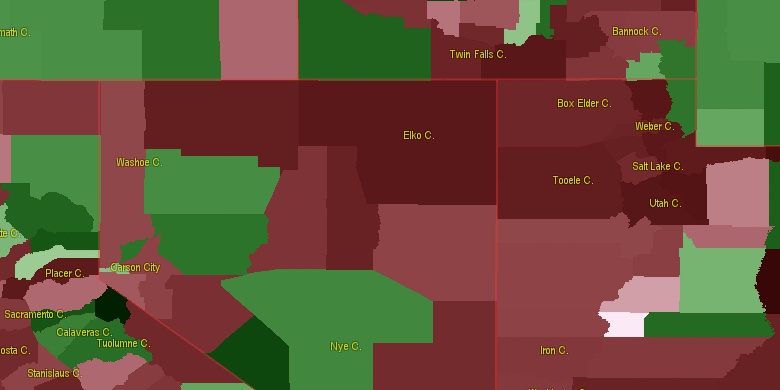
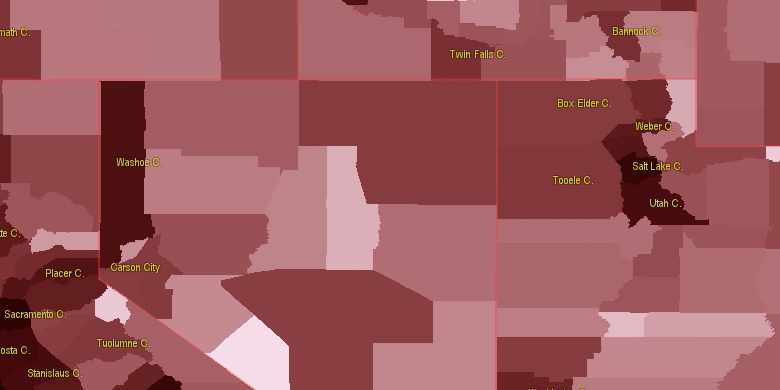
Estimated population for 2014[1]. Population density is in p./sq.mi [4]. Changes are for period 2010-2015. Value is %/year. Boundary lines are approx. 2012 [5]. Click on flag to hide it.
Population • Density • Changes • Legends • Position

[1860-1870] +11.68 %/yr
[1870-1880] +3.37 %/yr
[1880-1890] +1.23 %/yr
[1890-1900] +2.73 %/yr
[1900-1910] +3.33 %/yr
[1910-1920] +3.06 %/yr
[1920-1930] -0.53 %/yr
[1930-1940] +0.56 %/yr
[1940-1950] +0.47 %/yr
[1950-1960] +2.42 %/yr
[1960-1970] +1.16 %/yr
[1970-1980] +1.68 %/yr
[1980-1990] +0.94 %/yr
[1990-2000] +1.6 %/yr
[2000-2005] +1.07 %/yr
[2005-2010] +2.08 %/yr
[2010-2014] +0.09 %/yr
Looking for settlements in Box Elder County? Visit this page: Settlements in Box Elder County, UT
Population of Box Elder County by age groups male (M) and female (F)[1b]
| Age Gr. | (M) | (F) | Total |
| 0 to 4 | 2328 | 2097 | 4,425 |
| 5 to 9 | 2558 | 2403 | 4,961 |
| 10 to 14 | 2388 | 2328 | 4,716 |
| 15 to 19 | 2221 | 1862 | 4,083 |
| 20 to 24 | 1672 | 1481 | 3,153 |
| 25 to 29 | 1355 | 1531 | 2,886 |
| 30 to 34 | 1831 | 1779 | 3,610 |
| 35 to 39 | 1748 | 1805 | 3,553 |
| 40 to 44 | 1453 | 1368 | 2,821 |
| 45 to 49 | 1235 | 1267 | 2,502 |
| 50 to 54 | 1541 | 1517 | 3,058 |
| 55 to 59 | 1492 | 1478 | 2,970 |
| 60 to 64 | 1243 | 1243 | 2,486 |
| 65 to 69 | 926 | 901 | 1,827 |
| 70 to 74 | 700 | 838 | 1,538 |
| 75 to 79 | 638 | 681 | 1,319 |
| 80 to 84 | 420 | 502 | 922 |
| 85+ | 297 | 391 | 688 |
Box Elder County resident population estimates by Sex, Race, and Hispanic Origin[1b]. For full list of abbrevations see: population.us/about page.
| Race | Male | Female | Total |
| WAC | 25288 | 24676 | 49,964 |
| WA | 24811 | 24257 | 49,068 |
| NH | 23559 | 23276 | 46,835 |
| NHWAC | 23039 | 22654 | 45,693 |
| NHWA | 22650 | 22295 | 44,945 |
| H | 2487 | 2196 | 4,683 |
| HWAC | 2249 | 2022 | 4,271 |
| HWA | 2161 | 1962 | 4,123 |
| IAC | 531 | 510 | 1,041 |
| TOM | 499 | 452 | 951 |
| AAC | 383 | 479 | 862 |
| NHAAC | 350 | 455 | 805 |
| NHTOM | 407 | 388 | 795 |
| NHIAC | 329 | 352 | 681 |
| IA | 318 | 302 | 620 |
| AA | 200 | 313 | 513 |
| NHAA | 178 | 296 | 474 |
| BAC | 261 | 187 | 448 |
| NHIA | 176 | 194 | 370 |
| HIAC | 202 | 158 | 360 |
| NHBAC | 182 | 145 | 327 |
| BA | 164 | 103 | 267 |
| HIA | 142 | 108 | 250 |
| NAC | 94 | 90 | 184 |
| NHBA | 107 | 70 | 177 |
| HTOM | 92 | 64 | 156 |
| NHNAC | 75 | 75 | 150 |
| HBAC | 79 | 42 | 121 |
| NA | 54 | 45 | 99 |
| HBA | 57 | 33 | 90 |
| NHNA | 41 | 33 | 74 |
| HAAC | 33 | 24 | 57 |
| HAA | 22 | 17 | 39 |
| HNAC | 19 | 15 | 34 |
| HNA | 13 | 12 | 25 |
• Davis County population
59.5 mi,  132°
132°
• Weber County
65.1 mi,  111°
111°
• Cache County
67.5 mi,  83°
83°
• Bannock County
84.9 mi,  29°
29°
• Tooele County
79.8 mi,  183°
183°
• Cassia County
54.6 mi,  326°
326°
• Franklin County
73.4 mi,  58°
58°
• Morgan County
84.4 mi,  115°
115°
• Power County
74.8 mi,  7°
7°
• Oneida County
47.2 mi, 34°
[0] Calculated by population.us from last known population growth rate, not official data.
[1] County population - 2014, archived from the original, retrieved 02/23/2016
[1b] Annual County Resident Population Estimates by Age, Sex, Race, and Hispanic Origin, (used only data for 2014) archived from the original, retrieved 02/23/2016
[2] County population - 2000-2010, archived from the original, retrieved 02/23/2016
[3] Population of States and Counties of the United States: 1790 to 1992, PDF, 15 Mb, census.gov, retrieved 02/23/2016
[4] County area, latitude longitude data, retrieved 02/23/2016
[5] County boundaries, CSV files on boundaries.us, retrived 03/18/2016
*Weber Utah Notes
Page generated in 0.012 seconds© 2016 population.us | Terms of use | Contact