Last official estimated population of Zapata County was 14,056 (year 2014)[1]. This was 0.004% of total US population and 0.1% of total Texas state population. Area of Zapata County is 1,058.0 mi² (=2740.2 km²), in this year population density was 13.29 p/mi². If population growth rate would be same as in period 2010-2014 (+0.07%/yr), Zapata County population in 2026 would be 14,171 [0].
Historical population of Zapata County for period 1860-2014 [1] , [2] , [3]:
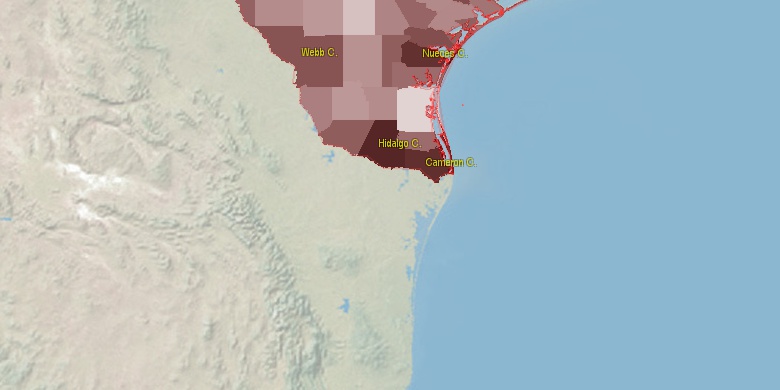
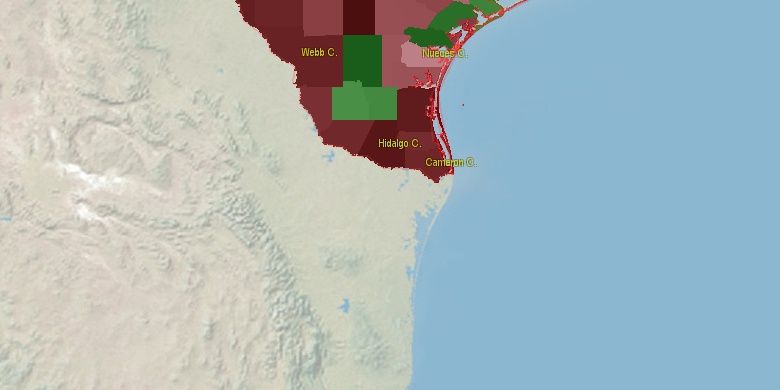
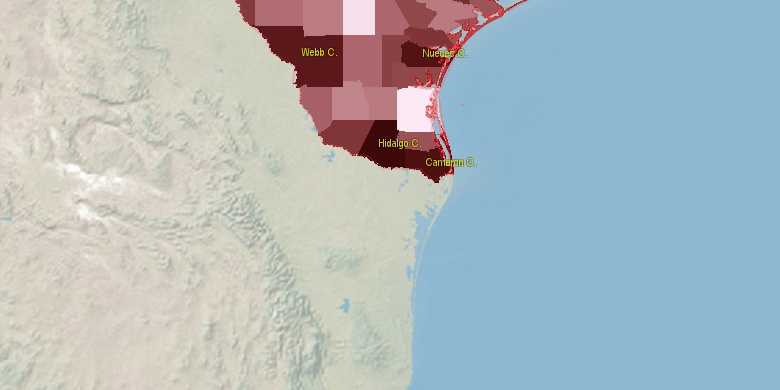
Estimated population for 2014[1]. Population density is in p./sq.mi [4]. Changes are for period 2010-2015. Value is %/year. Boundary lines are approx. 2012 [5]. Click on flag to hide it.
Population • Density • Changes • Legends • Position

[1860-1870] +1.77 %/yr
[1870-1880] +9.35 %/yr
[1880-1890] -0.21 %/yr
[1890-1900] +2.94 %/yr
[1900-1910] -2.2 %/yr
[1910-1920] -2.59 %/yr
[1920-1930] -0.21 %/yr
[1930-1940] +3.17 %/yr
[1940-1950] +1.18 %/yr
[1950-1960] -0.03 %/yr
[1960-1970] -0.09 %/yr
[1970-1980] +4.3 %/yr
[1980-1990] +3.42 %/yr
[1990-2000] +2.67 %/yr
[2000-2005] +1.54 %/yr
[2005-2010] +1.45 %/yr
[2010-2014] +0.07 %/yr
Looking for settlements in Zapata County? Visit this page: Settlements in Zapata County, TX
Population of Zapata County by age groups male (M) and female (F)[1b]
| Age Gr. | (M) | (F) | Total |
| 0 to 4 | 786 | 662 | 1,448 |
| 5 to 9 | 784 | 635 | 1,419 |
| 10 to 14 | 621 | 564 | 1,185 |
| 15 to 19 | 591 | 590 | 1,181 |
| 20 to 24 | 556 | 544 | 1,100 |
| 25 to 29 | 495 | 505 | 1,000 |
| 30 to 34 | 460 | 439 | 899 |
| 35 to 39 | 440 | 465 | 905 |
| 40 to 44 | 380 | 417 | 797 |
| 45 to 49 | 356 | 397 | 753 |
| 50 to 54 | 355 | 378 | 733 |
| 55 to 59 | 339 | 310 | 649 |
| 60 to 64 | 283 | 306 | 589 |
| 65 to 69 | 264 | 315 | 579 |
| 70 to 74 | 205 | 224 | 429 |
| 75 to 79 | 152 | 148 | 300 |
| 80 to 84 | 69 | 101 | 170 |
| 85+ | 77 | 106 | 183 |
Zapata County resident population estimates by Sex, Race, and Hispanic Origin[1b]. For full list of abbrevations see: population.us/about page.
| Race | Male | Female | Total |
| WAC | 7125 | 7034 | 14,159 |
| WA | 7108 | 7021 | 14,129 |
| H | 6750 | 6690 | 13,440 |
| HWAC | 6696 | 6659 | 13,355 |
| HWA | 6683 | 6652 | 13,335 |
| NH | 463 | 416 | 879 |
| NHWAC | 429 | 375 | 804 |
| NHWA | 425 | 369 | 794 |
| IAC | 52 | 32 | 84 |
| BAC | 42 | 32 | 74 |
| IA | 43 | 24 | 67 |
| HIAC | 42 | 19 | 61 |
| BA | 33 | 28 | 61 |
| HIA | 35 | 15 | 50 |
| NHBAC | 18 | 21 | 39 |
| HBAC | 24 | 11 | 35 |
| NHBA | 16 | 19 | 35 |
| AAC | 12 | 21 | 33 |
| AA | 12 | 20 | 32 |
| TOM | 17 | 13 | 30 |
| HBA | 17 | 9 | 26 |
| NHAA | 10 | 13 | 23 |
| NHIAC | 10 | 13 | 23 |
| NHAAC | 10 | 13 | 23 |
| HTOM | 13 | 7 | 20 |
| NHIA | 8 | 9 | 17 |
| NHTOM | 4 | 6 | 10 |
| HAAC | 2 | 8 | 10 |
| HAA | 2 | 7 | 9 |
| HNAC | 0 | 0 | 0 |
| NAC | 0 | 0 | 0 |
| NA | 0 | 0 | 0 |
| NHNA | 0 | 0 | 0 |
| NHNAC | 0 | 0 | 0 |
| HNA | 0 | 0 | 0 |
• Hidalgo County population
74.5 mi,  123°
123°
• Webb County
53.7 mi,  349°
349°
• Starr County
42.2 mi,  139°
139°
• Jim Wells County
84.1 mi,  52°
52°
• Kleberg County
98.4 mi,  71°
71°
• Duval County
63.3 mi,  41°
41°
• Brooks County
59.6 mi,  87°
87°
• La Salle County
93.7 mi,  3°
3°
• Jim Hogg County
29.9 mi,  84°
84°
• Kenedy County
98.3 mi, 94°
[0] Calculated by population.us from last known population growth rate, not official data.
[1] County population - 2014, archived from the original, retrieved 02/23/2016
[1b] Annual County Resident Population Estimates by Age, Sex, Race, and Hispanic Origin, (used only data for 2014) archived from the original, retrieved 02/23/2016
[2] County population - 2000-2010, archived from the original, retrieved 02/23/2016
[3] Population of States and Counties of the United States: 1790 to 1992, PDF, 15 Mb, census.gov, retrieved 02/23/2016
[4] County area, latitude longitude data, retrieved 02/23/2016
[5] County boundaries, CSV files on boundaries.us, retrived 03/18/2016
*Cameron; see note 4 Texas Notes
Page generated in 0.017 seconds© 2016 population.us | Terms of use | Contact