Last official estimated population of Brooks County was 7,210 (year 2014)[1]. This was 0.002% of total US population and 0% of total Texas state population. Area of Brooks County is 943.6 mi² (=2444 km²), in this year population density was 7.64 p/mi². If population growth rate would be same as in period 2010-2014 (-0.05%/yr), Brooks County population in 2026 would be 7,171 [0].
Historical population of Brooks County for period 1920-2014 [1] , [2] , [3]:
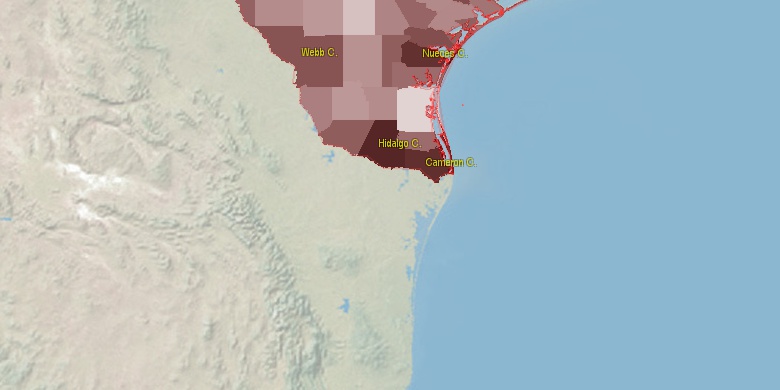
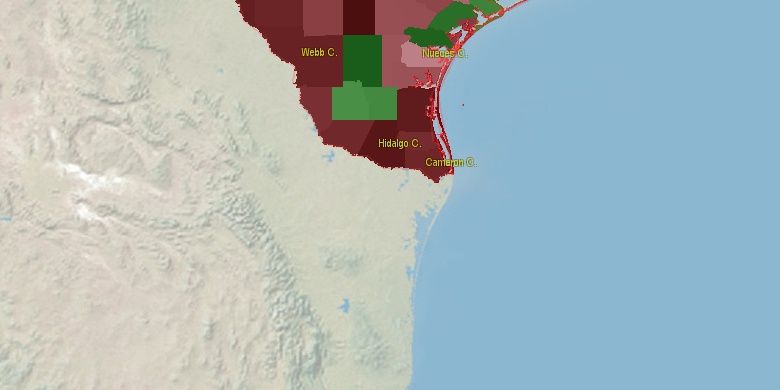
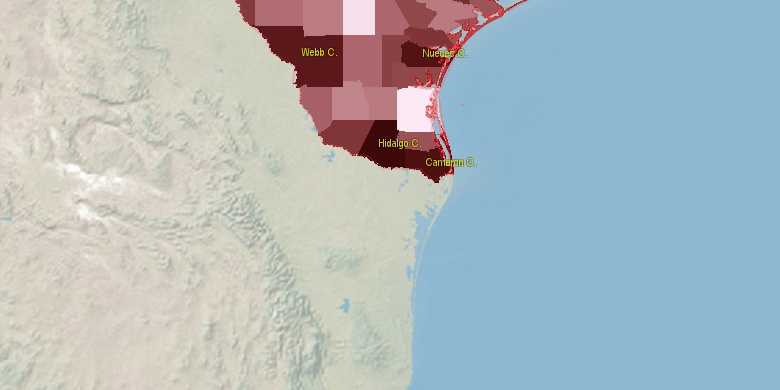
Estimated population for 2014[1]. Population density is in p./sq.mi [4]. Changes are for period 2010-2015. Value is %/year. Boundary lines are approx. 2012 [5]. Click on flag to hide it.
Population • Density • Changes • Legends • Position

[1920-1930] +2.61 %/yr
[1930-1940] +0.76 %/yr
[1940-1950] +3.75 %/yr
[1950-1960] -0.66 %/yr
[1960-1970] -0.72 %/yr
[1970-1980] +0.52 %/yr
[1980-1990] -0.27 %/yr
[1990-2000] -0.28 %/yr
[2000-2005] -1.07 %/yr
[2005-2010] -0.91 %/yr
[2010-2014] -0.05 %/yr
Looking for settlements in Brooks County? Visit this page: Settlements in Brooks County, TX
Population of Brooks County by age groups male (M) and female (F)[1b]
| Age Gr. | (M) | (F) | Total |
| 0 to 4 | 322 | 340 | 662 |
| 5 to 9 | 308 | 265 | 573 |
| 10 to 14 | 253 | 238 | 491 |
| 15 to 19 | 276 | 206 | 482 |
| 20 to 24 | 278 | 241 | 519 |
| 25 to 29 | 226 | 199 | 425 |
| 30 to 34 | 219 | 234 | 453 |
| 35 to 39 | 170 | 162 | 332 |
| 40 to 44 | 167 | 173 | 340 |
| 45 to 49 | 184 | 184 | 368 |
| 50 to 54 | 202 | 241 | 443 |
| 55 to 59 | 201 | 217 | 418 |
| 60 to 64 | 188 | 191 | 379 |
| 65 to 69 | 209 | 209 | 418 |
| 70 to 74 | 138 | 160 | 298 |
| 75 to 79 | 124 | 136 | 260 |
| 80 to 84 | 60 | 111 | 171 |
| 85+ | 45 | 117 | 162 |
Brooks County resident population estimates by Sex, Race, and Hispanic Origin[1b]. For full list of abbrevations see: population.us/about page.
| Race | Male | Female | Total |
| WAC | 3474 | 3492 | 6,966 |
| WA | 3457 | 3477 | 6,934 |
| H | 3223 | 3226 | 6,449 |
| HWAC | 3181 | 3176 | 6,357 |
| HWA | 3172 | 3167 | 6,339 |
| NH | 347 | 398 | 745 |
| NHWAC | 293 | 316 | 609 |
| NHWA | 285 | 310 | 595 |
| AAC | 39 | 61 | 100 |
| BAC | 46 | 53 | 99 |
| AA | 39 | 60 | 99 |
| NHAAC | 32 | 56 | 88 |
| NHAA | 32 | 56 | 88 |
| BA | 35 | 42 | 77 |
| IAC | 27 | 32 | 59 |
| HBAC | 22 | 28 | 50 |
| NHBAC | 24 | 25 | 49 |
| IA | 21 | 27 | 48 |
| HIAC | 21 | 24 | 45 |
| HBA | 16 | 24 | 40 |
| HIA | 18 | 20 | 38 |
| NHBA | 19 | 18 | 37 |
| TOM | 17 | 16 | 33 |
| HTOM | 9 | 9 | 18 |
| NHTOM | 8 | 7 | 15 |
| NHIAC | 6 | 8 | 14 |
| HAAC | 7 | 5 | 12 |
| HAA | 7 | 4 | 11 |
| NHIA | 3 | 7 | 10 |
| HNAC | 1 | 2 | 3 |
| NAC | 1 | 2 | 3 |
| NA | 1 | 2 | 3 |
| HNA | 1 | 2 | 3 |
| NHNA | 0 | 0 | 0 |
| NHNAC | 0 | 0 | 0 |
• Hidalgo County population
44.2 mi,  177°
177°
• Nueces County
64.7 mi,  41°
41°
• Starr County
47.6 mi,  222°
222°
• Jim Wells County
48.9 mi,  8°
8°
• Kleberg County
44 mi,  50°
50°
• Willacy County
54.7 mi,  134°
134°
• Zapata County
59.6 mi,  267°
267°
• Duval County
47.9 mi,  338°
338°
• Jim Hogg County
29.8 mi, 270°
• Kenedy County
39.7 mi,  104°
104°
[0] Calculated by population.us from last known population growth rate, not official data.
[1] County population - 2014, archived from the original, retrieved 02/23/2016
[1b] Annual County Resident Population Estimates by Age, Sex, Race, and Hispanic Origin, (used only data for 2014) archived from the original, retrieved 02/23/2016
[2] County population - 2000-2010, archived from the original, retrieved 02/23/2016
[3] Population of States and Counties of the United States: 1790 to 1992, PDF, 15 Mb, census.gov, retrieved 02/23/2016
[4] County area, latitude longitude data, retrieved 02/23/2016
[5] County boundaries, CSV files on boundaries.us, retrived 03/18/2016
*Hidalgo, Starr Texas Notes
Page generated in 0.02 seconds© 2016 population.us | Terms of use | Contact