Last official estimated population of Lexington County was 263,325 (year 2014)[1]. This was 0.083% of total US population and 5.4% of total South Carolina state population. Area of Lexington County is 757.7 mi² (=1962.5 km²), in this year population density was 347.52 p/mi². If population growth rate would be same as in period 2010-2014 (+0.09%/yr), Lexington County population in 2026 would be 266,147 [0].
Historical population of Lexington County for period 1810-2014 [1] , [2] , [3]:
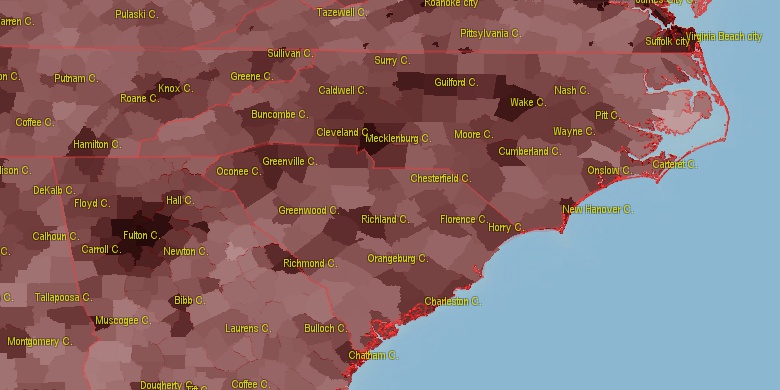
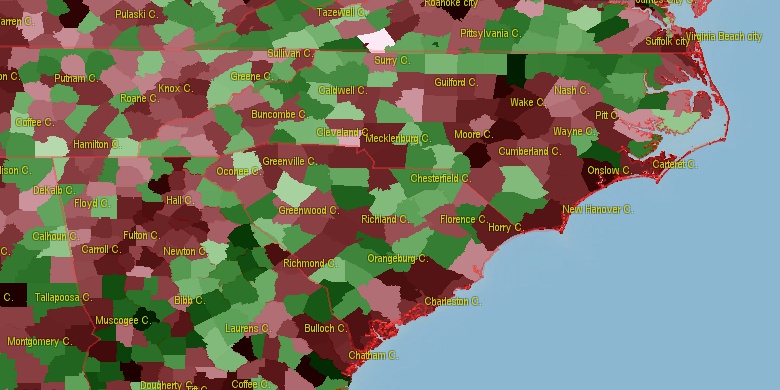
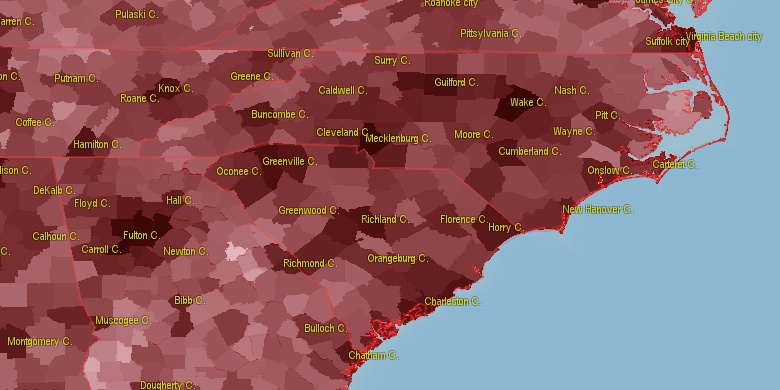
Estimated population for 2014[1]. Population density is in p./sq.mi [4]. Changes are for period 2010-2015. Value is %/year. Boundary lines are approx. 2012 [5]. Click on flag to hide it.
Population • Density • Changes • Legends • Position

[1810-1820] +1.98 %/yr
[1820-1830] +1.15 %/yr
[1830-1840] +2.94 %/yr
[1840-1850] +0.66 %/yr
[1850-1860] +1.88 %/yr
[1860-1870] -1.8 %/yr
[1870-1880] +3.64 %/yr
[1880-1890] +1.8 %/yr
[1890-1900] +2.08 %/yr
[1900-1910] +1.63 %/yr
[1910-1920] +1.08 %/yr
[1920-1930] +0.23 %/yr
[1930-1940] -0.14 %/yr
[1940-1950] +2.09 %/yr
[1950-1960] +3.21 %/yr
[1960-1970] +3.9 %/yr
[1970-1980] +4.66 %/yr
[1980-1990] +1.79 %/yr
[1990-2000] +2.58 %/yr
[2000-2005] +1.71 %/yr
[2005-2010] +2.21 %/yr
[2010-2014] +0.09 %/yr
Looking for settlements in Lexington County? Visit this page: Settlements in Lexington County, SC
Population of Lexington County by age groups male (M) and female (F)[1b]
| Age Gr. | (M) | (F) | Total |
| 0 to 4 | 8708 | 8317 | 17,025 |
| 5 to 9 | 9441 | 9143 | 18,584 |
| 10 to 14 | 9621 | 9202 | 18,823 |
| 15 to 19 | 8862 | 8303 | 17,165 |
| 20 to 24 | 8717 | 8489 | 17,206 |
| 25 to 29 | 9023 | 9185 | 18,208 |
| 30 to 34 | 8901 | 9463 | 18,364 |
| 35 to 39 | 8590 | 9000 | 17,590 |
| 40 to 44 | 9459 | 9850 | 19,309 |
| 45 to 49 | 9460 | 9658 | 19,118 |
| 50 to 54 | 10138 | 10534 | 20,672 |
| 55 to 59 | 9378 | 10081 | 19,459 |
| 60 to 64 | 7938 | 8901 | 16,839 |
| 65 to 69 | 6756 | 7495 | 14,251 |
| 70 to 74 | 4744 | 5345 | 10,089 |
| 75 to 79 | 2875 | 3632 | 6,507 |
| 80 to 84 | 1826 | 2633 | 4,459 |
| 85+ | 1360 | 2860 | 4,220 |
Lexington County resident population estimates by Sex, Race, and Hispanic Origin[1b]. For full list of abbrevations see: population.us/about page.
| Race | Male | Female | Total |
| NH | 126811 | 134854 | 261,665 |
| WAC | 112518 | 116195 | 228,713 |
| WA | 110318 | 113989 | 224,307 |
| NHWAC | 104631 | 109850 | 214,481 |
| NHWA | 102631 | 107833 | 210,464 |
| BAC | 21221 | 23682 | 44,903 |
| NHBAC | 20428 | 22957 | 43,385 |
| BA | 19884 | 22281 | 42,165 |
| NHBA | 19204 | 21678 | 40,882 |
| H | 8986 | 7237 | 16,223 |
| HWAC | 7887 | 6345 | 14,232 |
| HWA | 7687 | 6156 | 13,843 |
| AAC | 2756 | 3170 | 5,926 |
| NHAAC | 2633 | 3059 | 5,692 |
| TOM | 2425 | 2447 | 4,872 |
| AA | 2226 | 2630 | 4,856 |
| NHAA | 2154 | 2563 | 4,717 |
| NHTOM | 2193 | 2227 | 4,420 |
| IAC | 1686 | 1489 | 3,175 |
| NHIAC | 1309 | 1231 | 2,540 |
| HBAC | 793 | 725 | 1,518 |
| IA | 824 | 628 | 1,452 |
| HBA | 680 | 603 | 1,283 |
| NHIA | 557 | 476 | 1,033 |
| HIAC | 377 | 258 | 635 |
| HTOM | 232 | 220 | 452 |
| HIA | 267 | 152 | 419 |
| NAC | 218 | 199 | 417 |
| NHNAC | 149 | 149 | 298 |
| NA | 120 | 116 | 236 |
| HAAC | 123 | 111 | 234 |
| NHNA | 72 | 77 | 149 |
| HAA | 72 | 67 | 139 |
| HNAC | 69 | 50 | 119 |
| HNA | 48 | 39 | 87 |
• Richland County population
23.5 mi,  66°
66°
• Aiken County
31.4 mi,  221°
221°
• Orangeburg County
41.5 mi,  139°
139°
• Newberry County
33.2 mi,  325°
325°
• Edgefield County
40.7 mi,  258°
258°
• Fairfield County
35.7 mi,  13°
13°
• Barnwell County
44.6 mi,  192°
192°
• Saluda County
27.2 mi,  286°
286°
• Bamberg County
49.3 mi,  165°
165°
• Calhoun County
32 mi,  118°
118°
[0] Calculated by population.us from last known population growth rate, not official data.
[1] County population - 2014, archived from the original, retrieved 02/23/2016
[1b] Annual County Resident Population Estimates by Age, Sex, Race, and Hispanic Origin, (used only data for 2014) archived from the original, retrieved 02/23/2016
[2] County population - 2000-2010, archived from the original, retrieved 02/23/2016
[3] Population of States and Counties of the United States: 1790 to 1992, PDF, 15 Mb, census.gov, retrieved 02/23/2016
[4] County area, latitude longitude data, retrieved 02/23/2016
[5] County boundaries, CSV files on boundaries.us, retrived 03/18/2016
*Orangeburg South Carolina Notes
Page generated in 0.007 seconds© 2016 population.us | Terms of use | Contact