Last official estimated population of Bamberg County was 15,970 (year 2014)[1]. This was 0.005% of total US population and 0.3% of total South Carolina state population. Area of Bamberg County is 395.6 mi² (=1024.5 km²), in this year population density was 40.37 p/mi². If population growth rate would be same as in period 2010-2014 (-0.03%/yr), Bamberg County population in 2026 would be 15,919 [0].
Historical population of Bamberg County for period 1900-2014 [1] , [2] , [3]:
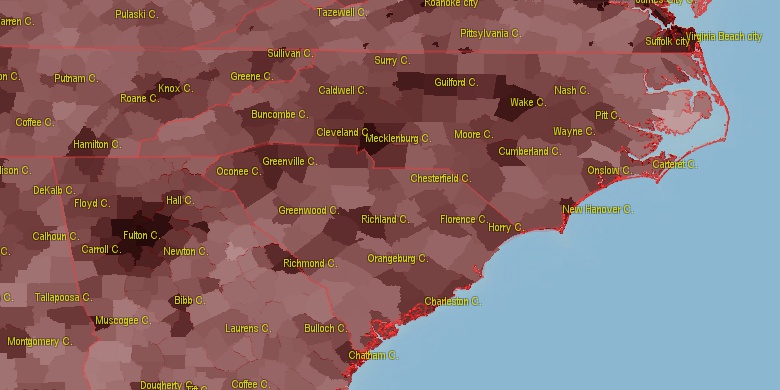
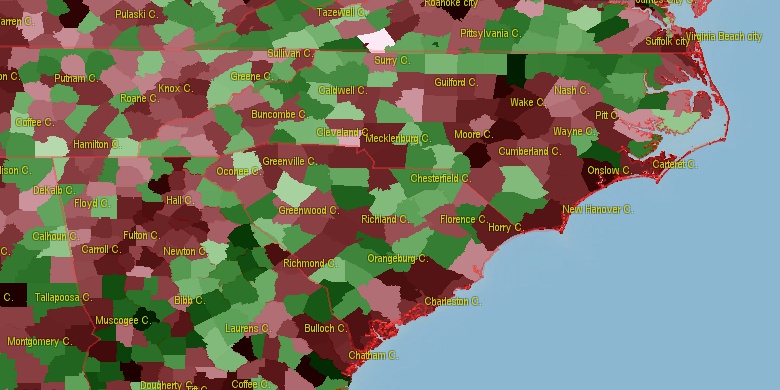
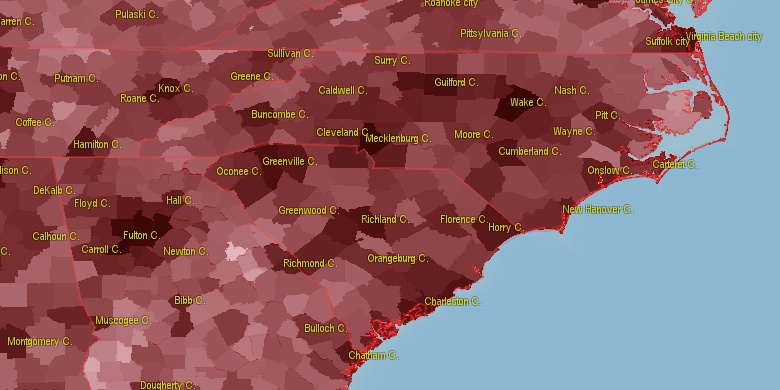
Estimated population for 2014[1]. Population density is in p./sq.mi [4]. Changes are for period 2010-2015. Value is %/year. Boundary lines are approx. 2012 [5]. Click on flag to hide it.
Population • Density • Changes • Legends • Position

[1900-1910] +0.7 %/yr
[1910-1920] +1.23 %/yr
[1920-1930] -0.77 %/yr
[1930-1940] -0.4 %/yr
[1940-1950] -0.61 %/yr
[1950-1960] -0.74 %/yr
[1960-1970] -0.2 %/yr
[1970-1980] +1.28 %/yr
[1980-1990] -0.69 %/yr
[1990-2000] -0.12 %/yr
[2000-2005] -0.42 %/yr
[2005-2010] -0.46 %/yr
[2010-2014] -0.03 %/yr
Looking for settlements in Bamberg County? Visit this page: Settlements in Bamberg County, SC
Population of Bamberg County by age groups male (M) and female (F)[1b]
| Age Gr. | (M) | (F) | Total |
| 0 to 4 | 388 | 388 | 776 |
| 5 to 9 | 415 | 422 | 837 |
| 10 to 14 | 443 | 420 | 863 |
| 15 to 19 | 719 | 651 | 1,370 |
| 20 to 24 | 746 | 701 | 1,447 |
| 25 to 29 | 349 | 384 | 733 |
| 30 to 34 | 348 | 355 | 703 |
| 35 to 39 | 318 | 380 | 698 |
| 40 to 44 | 381 | 426 | 807 |
| 45 to 49 | 466 | 464 | 930 |
| 50 to 54 | 505 | 556 | 1,061 |
| 55 to 59 | 524 | 563 | 1,087 |
| 60 to 64 | 513 | 581 | 1,094 |
| 65 to 69 | 424 | 502 | 926 |
| 70 to 74 | 319 | 363 | 682 |
| 75 to 79 | 202 | 273 | 475 |
| 80 to 84 | 136 | 205 | 341 |
| 85+ | 116 | 236 | 352 |
Bamberg County resident population estimates by Sex, Race, and Hispanic Origin[1b]. For full list of abbrevations see: population.us/about page.
| Race | Male | Female | Total |
| NH | 7147 | 7752 | 14,899 |
| BAC | 4405 | 4971 | 9,376 |
| NHBAC | 4355 | 4944 | 9,299 |
| BA | 4353 | 4929 | 9,282 |
| NHBA | 4305 | 4905 | 9,210 |
| WAC | 2885 | 2861 | 5,746 |
| WA | 2811 | 2806 | 5,617 |
| NHWAC | 2778 | 2775 | 5,553 |
| NHWA | 2710 | 2723 | 5,433 |
| H | 165 | 118 | 283 |
| HWAC | 107 | 86 | 193 |
| HWA | 101 | 83 | 184 |
| TOM | 84 | 67 | 151 |
| NHTOM | 77 | 63 | 140 |
| IAC | 53 | 60 | 113 |
| NHIAC | 41 | 52 | 93 |
| AAC | 50 | 41 | 91 |
| NHAAC | 50 | 41 | 91 |
| HBAC | 50 | 27 | 77 |
| HBA | 48 | 24 | 72 |
| AA | 37 | 32 | 69 |
| NHAA | 37 | 32 | 69 |
| IA | 23 | 32 | 55 |
| NHIA | 17 | 26 | 43 |
| HIAC | 12 | 8 | 20 |
| HIA | 6 | 6 | 12 |
| HTOM | 7 | 4 | 11 |
| NAC | 6 | 5 | 11 |
| NA | 4 | 4 | 8 |
| NHNAC | 3 | 4 | 7 |
| HNAC | 3 | 1 | 4 |
| HNA | 3 | 1 | 4 |
| NHNA | 1 | 3 | 4 |
| HAAC | 0 | 0 | 0 |
| HAA | 0 | 0 | 0 |
• Lexington County population
49.3 mi,  345°
345°
• Aiken County
41.2 mi,  305°
305°
• Dorchester County
38.4 mi,  102°
102°
• Orangeburg County
21.6 mi,  41°
41°
• Colleton County
34.3 mi,  137°
137°
• Barnwell County
22.4 mi,  280°
280°
• Hampton County
29.8 mi,  190°
190°
• Calhoun County
36.2 mi,  25°
25°
• Screven County
45.5 mi,  225°
225°
• Allendale County
23.7 mi, 229°
[0] Calculated by population.us from last known population growth rate, not official data.
[1] County population - 2014, archived from the original, retrieved 02/23/2016
[1b] Annual County Resident Population Estimates by Age, Sex, Race, and Hispanic Origin, (used only data for 2014) archived from the original, retrieved 02/23/2016
[2] County population - 2000-2010, archived from the original, retrieved 02/23/2016
[3] Population of States and Counties of the United States: 1790 to 1992, PDF, 15 Mb, census.gov, retrieved 02/23/2016
[4] County area, latitude longitude data, retrieved 02/23/2016
[5] County boundaries, CSV files on boundaries.us, retrived 03/18/2016
*Barnwell South Carolina Notes
Page generated in 0.021 seconds© 2016 population.us | Terms of use | Contact