Last official estimated population of Haskell County was 12,746 (year 2014)[1]. This was 0.004% of total US population and 0.3% of total Oklahoma state population. Area of Haskell County is 625.3 mi² (=1619.5 km²), in this year population density was 20.38 p/mi². If population growth rate would be same as in period 2010-2014 (-0.05%/yr), Haskell County population in 2026 would be 12,677 [0].
Historical population of Haskell County for period 1880-2014 [1] , [2] , [3]:
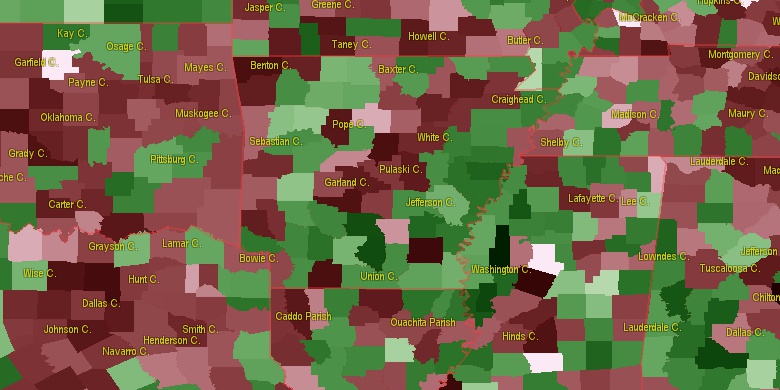
Estimated population for 2014[1]. Population density is in p./sq.mi [4]. Changes are for period 2010-2015. Value is %/year. Boundary lines are approx. 2012 [5]. Click on flag to hide it.
Population • Density • Changes • Legends • Position


[1880-1890] NAN %/yr
[1890-1900] +INF %/yr
[1900-1910] +1.13 %/yr
[1910-1920] +0.27 %/yr
[1920-1930] -1.78 %/yr
[1930-1940] +0.66 %/yr
[1940-1950] -2.6 %/yr
[1950-1960] -3.71 %/yr
[1960-1970] +0.49 %/yr
[1970-1980] +1.4 %/yr
[1980-1990] -0.06 %/yr
[1990-2000] +0.74 %/yr
[2000-2005] +0.67 %/yr
[2005-2010] +0.96 %/yr
[2010-2014] -0.05 %/yr
Looking for settlements in Haskell County? Visit this page: Settlements in Haskell County, OK
Population of Haskell County by age groups male (M) and female (F)[1b]
| Age Gr. | (M) | (F) | Total |
| 0 to 4 | 379 | 390 | 769 |
| 5 to 9 | 445 | 426 | 871 |
| 10 to 14 | 514 | 391 | 905 |
| 15 to 19 | 451 | 413 | 864 |
| 20 to 24 | 411 | 328 | 739 |
| 25 to 29 | 348 | 354 | 702 |
| 30 to 34 | 389 | 361 | 750 |
| 35 to 39 | 367 | 357 | 724 |
| 40 to 44 | 354 | 358 | 712 |
| 45 to 49 | 394 | 386 | 780 |
| 50 to 54 | 415 | 462 | 877 |
| 55 to 59 | 401 | 428 | 829 |
| 60 to 64 | 431 | 391 | 822 |
| 65 to 69 | 404 | 439 | 843 |
| 70 to 74 | 314 | 350 | 664 |
| 75 to 79 | 216 | 218 | 434 |
| 80 to 84 | 122 | 179 | 301 |
| 85+ | 121 | 189 | 310 |
Haskell County resident population estimates by Sex, Race, and Hispanic Origin[1b]. For full list of abbrevations see: population.us/about page.
| Race | Male | Female | Total |
| NH | 6169 | 6216 | 12,385 |
| WAC | 5334 | 5239 | 10,573 |
| NHWAC | 5083 | 5071 | 10,154 |
| WA | 4878 | 4794 | 9,672 |
| NHWA | 4647 | 4649 | 9,296 |
| IAC | 1462 | 1475 | 2,937 |
| NHIAC | 1401 | 1428 | 2,829 |
| IA | 1047 | 1064 | 2,111 |
| NHIA | 1001 | 1036 | 2,037 |
| TOM | 463 | 455 | 918 |
| NHTOM | 443 | 431 | 874 |
| H | 307 | 204 | 511 |
| HWAC | 251 | 168 | 419 |
| HWA | 231 | 145 | 376 |
| BAC | 80 | 90 | 170 |
| NHBAC | 70 | 81 | 151 |
| AAC | 64 | 65 | 129 |
| NHAAC | 61 | 64 | 125 |
| HIAC | 61 | 47 | 108 |
| AA | 42 | 54 | 96 |
| NHAA | 41 | 54 | 95 |
| BA | 45 | 49 | 94 |
| NHBA | 37 | 44 | 81 |
| HIA | 46 | 28 | 74 |
| HTOM | 20 | 24 | 44 |
| HBAC | 10 | 9 | 19 |
| NAC | 6 | 8 | 14 |
| HBA | 8 | 5 | 13 |
| NHNAC | 4 | 5 | 9 |
| HNAC | 2 | 3 | 5 |
| NA | 1 | 4 | 5 |
| HAAC | 3 | 1 | 4 |
| HNA | 1 | 2 | 3 |
| NHNA | 0 | 2 | 2 |
| HAA | 1 | 0 | 1 |
• Sebastian County population
47.2 mi,  92°
92°
• Muskogee County
30.8 mi,  329°
329°
• Crawford County
54.8 mi,  63°
63°
• Le Flore County
32.9 mi,  134°
134°
• Cherokee County
46.9 mi,  7°
7°
• Pittsburg County
41.9 mi,  239°
239°
• Sequoyah County
27.5 mi,  47°
47°
• Adair County
52.7 mi,  29°
29°
• McIntosh County
33.1 mi,  286°
286°
• Latimer County
26.3 mi,  200°
200°
[0] Calculated by population.us from last known population growth rate, not official data.
[1] County population - 2014, archived from the original, retrieved 02/23/2016
[1b] Annual County Resident Population Estimates by Age, Sex, Race, and Hispanic Origin, (used only data for 2014) archived from the original, retrieved 02/23/2016
[2] County population - 2000-2010, archived from the original, retrieved 02/23/2016
[3] Population of States and Counties of the United States: 1790 to 1992, PDF, 15 Mb, census.gov, retrieved 02/23/2016
[4] County area, latitude longitude data, retrieved 02/23/2016
[5] County boundaries, CSV files on boundaries.us, retrived 03/18/2016
*Choctaw Nation Oklahoma Notes
Page generated in 0.018 seconds© 2016 population.us | Terms of use | Contact