Last official estimated population of Haywood County was 58,950 (year 2014)[1]. This was 0.018% of total US population and 0.6% of total North Carolina state population. Area of Haywood County is 554.6 mi² (=1436.5 km²), in this year population density was 106.29 p/mi². If population growth rate would be same as in period 2010-2014 (-0.04%/yr), Haywood County population in 2026 would be 58,693 [0].
Historical population of Haywood County for period 1810-2014 [1] , [2] , [3]:
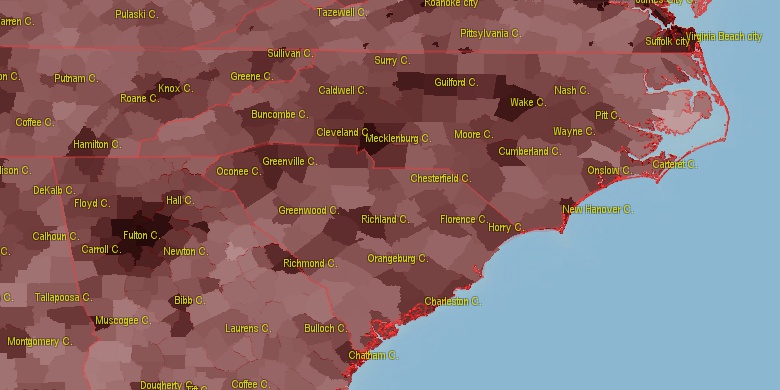
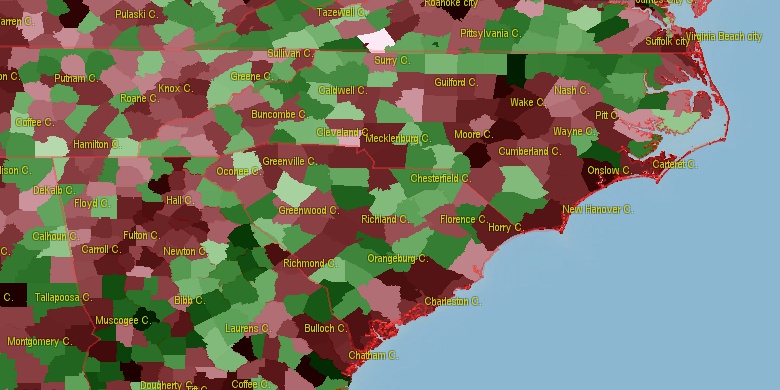
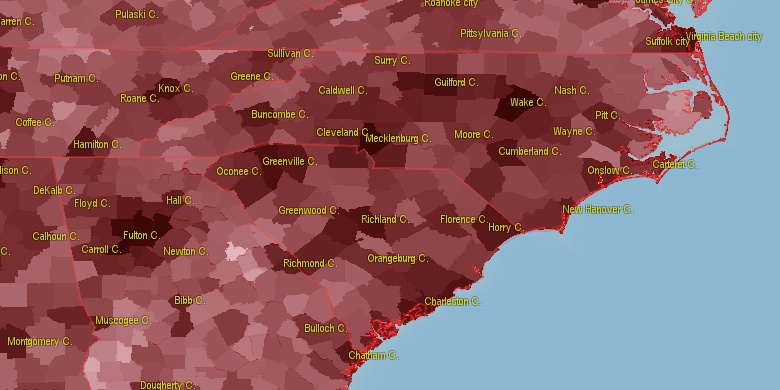
Estimated population for 2014[1]. Population density is in p./sq.mi [4]. Changes are for period 2010-2015. Value is %/year. Boundary lines are approx. 2012 [5]. Click on flag to hide it.
Population • Density • Changes • Legends • Position

[1810-1820] +3.89 %/yr
[1820-1830] +1.18 %/yr
[1830-1840] +0.84 %/yr
[1840-1850] +3.58 %/yr
[1850-1860] -1.96 %/yr
[1860-1870] +3.16 %/yr
[1870-1880] +2.63 %/yr
[1880-1890] +2.65 %/yr
[1890-1900] +1.97 %/yr
[1900-1910] +2.62 %/yr
[1910-1920] +1.12 %/yr
[1920-1930] +1.87 %/yr
[1930-1940] +2.1 %/yr
[1940-1950] +0.78 %/yr
[1950-1960] +0.54 %/yr
[1960-1970] +0.49 %/yr
[1970-1980] +1.09 %/yr
[1980-1990] +0.1 %/yr
[1990-2000] +1.41 %/yr
[2000-2005] +1.11 %/yr
[2005-2010] +0.67 %/yr
[2010-2014] -0.04 %/yr
Looking for settlements in Haywood County? Visit this page: Settlements in Haywood County, NC
Population of Haywood County by age groups male (M) and female (F)[1b]
| Age Gr. | (M) | (F) | Total |
| 0 to 4 | 1314 | 1326 | 2,640 |
| 5 to 9 | 1508 | 1464 | 2,972 |
| 10 to 14 | 1714 | 1556 | 3,270 |
| 15 to 19 | 1599 | 1539 | 3,138 |
| 20 to 24 | 1709 | 1500 | 3,209 |
| 25 to 29 | 1508 | 1575 | 3,083 |
| 30 to 34 | 1454 | 1493 | 2,947 |
| 35 to 39 | 1522 | 1585 | 3,107 |
| 40 to 44 | 1822 | 1882 | 3,704 |
| 45 to 49 | 1925 | 2060 | 3,985 |
| 50 to 54 | 2121 | 2322 | 4,443 |
| 55 to 59 | 2052 | 2364 | 4,416 |
| 60 to 64 | 2129 | 2320 | 4,449 |
| 65 to 69 | 2104 | 2394 | 4,498 |
| 70 to 74 | 1669 | 1898 | 3,567 |
| 75 to 79 | 1170 | 1404 | 2,574 |
| 80 to 84 | 734 | 1063 | 1,797 |
| 85+ | 579 | 1093 | 1,672 |
Haywood County resident population estimates by Sex, Race, and Hispanic Origin[1b]. For full list of abbrevations see: population.us/about page.
| Race | Male | Female | Total |
| WAC | 27898 | 30108 | 58,006 |
| WA | 27628 | 29776 | 57,404 |
| NH | 27511 | 29781 | 57,292 |
| NHWAC | 26862 | 29107 | 55,969 |
| NHWA | 26627 | 28810 | 55,437 |
| H | 1122 | 1057 | 2,179 |
| HWAC | 1036 | 1001 | 2,037 |
| HWA | 1001 | 966 | 1,967 |
| BAC | 487 | 460 | 947 |
| NHBAC | 456 | 431 | 887 |
| IAC | 373 | 393 | 766 |
| BA | 390 | 340 | 730 |
| NHBA | 373 | 326 | 699 |
| TOM | 292 | 357 | 649 |
| NHIAC | 300 | 339 | 639 |
| NHTOM | 254 | 322 | 576 |
| AAC | 158 | 222 | 380 |
| IA | 198 | 174 | 372 |
| NHAAC | 142 | 217 | 359 |
| AA | 115 | 181 | 296 |
| NHIA | 147 | 141 | 288 |
| NHAA | 103 | 176 | 279 |
| HIAC | 73 | 54 | 127 |
| HIA | 51 | 33 | 84 |
| HTOM | 38 | 35 | 73 |
| HBAC | 31 | 29 | 60 |
| NAC | 17 | 17 | 34 |
| HBA | 17 | 14 | 31 |
| NHNAC | 13 | 13 | 26 |
| HAAC | 16 | 5 | 21 |
| NA | 10 | 10 | 20 |
| HAA | 12 | 5 | 17 |
| NHNA | 7 | 6 | 13 |
| HNAC | 4 | 4 | 8 |
| HNA | 3 | 4 | 7 |
• Buncombe County population
25.1 mi,  81°
81°
• Henderson County
31.7 mi,  118°
118°
• Sevier County
34.8 mi,  299°
299°
• Jefferson County
42.9 mi,  322°
322°
• Jackson County
20.9 mi,  203°
203°
• Cocke County
26.1 mi,  341°
341°
• Macon County
37.7 mi,  222°
222°
• Transylvania County
25.5 mi,  159°
159°
• Madison County
25.7 mi,  34°
34°
• Swain County
27.7 mi,  271°
271°
[0] Calculated by population.us from last known population growth rate, not official data.
[1] County population - 2014, archived from the original, retrieved 02/23/2016
[1b] Annual County Resident Population Estimates by Age, Sex, Race, and Hispanic Origin, (used only data for 2014) archived from the original, retrieved 02/23/2016
[2] County population - 2000-2010, archived from the original, retrieved 02/23/2016
[3] Population of States and Counties of the United States: 1790 to 1992, PDF, 15 Mb, census.gov, retrieved 02/23/2016
[4] County area, latitude longitude data, retrieved 02/23/2016
[5] County boundaries, CSV files on boundaries.us, retrived 03/18/2016
*Buncombe North Carolina Notes
Page generated in 0.01 seconds© 2016 population.us | Terms of use | Contact