Last official estimated population of Judith Basin County was 2,062 (year 2014)[1]. This was 0.001% of total US population and 0.2% of total Montana state population. Area of Judith Basin County is 1,870.6 mi² (=4844.7 km²), in this year population density was 1.10 p/mi². If population growth rate would be same as in period 2010-2014 (-0.12%/yr), Judith Basin County population in 2026 would be 2,032 [0].
Historical population of Judith Basin County for period 1930-2014 [1] , [2] , [3]:
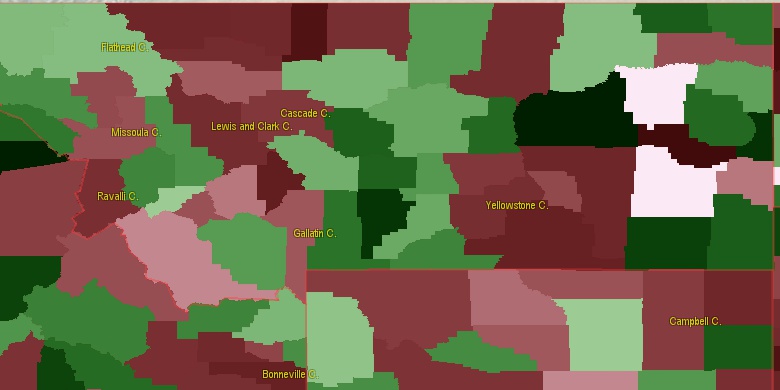
Estimated population for 2014[1]. Population density is in p./sq.mi [4]. Changes are for period 2010-2015. Value is %/year. Boundary lines are approx. 2012 [5]. Click on flag to hide it.
Population • Density • Changes • Legends • Position


[1930-1940] -3.53 %/yr
[1940-1950] -1.32 %/yr
[1950-1960] -0.37 %/yr
[1960-1970] -1.45 %/yr
[1970-1980] -0.08 %/yr
[1980-1990] -1.47 %/yr
[1990-2000] +0.19 %/yr
[2000-2005] -1.46 %/yr
[2005-2010] -0.84 %/yr
[2010-2014] -0.12 %/yr
Looking for settlements in Judith Basin County? Visit this page: Settlements in Judith Basin County, MT
Population of Judith Basin County by age groups male (M) and female (F)[1b]
| Age Gr. | (M) | (F) | Total |
| 0 to 4 | 37 | 37 | 74 |
| 5 to 9 | 67 | 53 | 120 |
| 10 to 14 | 58 | 59 | 117 |
| 15 to 19 | 60 | 39 | 99 |
| 20 to 24 | 61 | 41 | 102 |
| 25 to 29 | 30 | 32 | 62 |
| 30 to 34 | 52 | 58 | 110 |
| 35 to 39 | 49 | 40 | 89 |
| 40 to 44 | 46 | 47 | 93 |
| 45 to 49 | 61 | 52 | 113 |
| 50 to 54 | 87 | 114 | 201 |
| 55 to 59 | 99 | 75 | 174 |
| 60 to 64 | 100 | 90 | 190 |
| 65 to 69 | 78 | 59 | 137 |
| 70 to 74 | 66 | 58 | 124 |
| 75 to 79 | 37 | 41 | 78 |
| 80 to 84 | 34 | 27 | 61 |
| 85+ | 15 | 32 | 47 |
Judith Basin County resident population estimates by Sex, Race, and Hispanic Origin[1b]. For full list of abbrevations see: population.us/about page.
| Race | Male | Female | Total |
| WAC | 1024 | 940 | 1,964 |
| NH | 1024 | 934 | 1,958 |
| WA | 1017 | 933 | 1,950 |
| NHWAC | 1011 | 920 | 1,931 |
| NHWA | 1004 | 913 | 1,917 |
| HWA | 13 | 20 | 33 |
| H | 13 | 20 | 33 |
| HWAC | 13 | 20 | 33 |
| NHIAC | 13 | 14 | 27 |
| IAC | 13 | 14 | 27 |
| IA | 10 | 10 | 20 |
| NHIA | 10 | 10 | 20 |
| TOM | 8 | 7 | 15 |
| NHTOM | 8 | 7 | 15 |
| NHAAC | 4 | 4 | 8 |
| AAC | 4 | 4 | 8 |
| NHAA | 2 | 3 | 5 |
| AA | 2 | 3 | 5 |
| NHBAC | 3 | 1 | 4 |
| BAC | 3 | 1 | 4 |
| NHNAC | 1 | 2 | 3 |
| NAC | 1 | 2 | 3 |
| BA | 0 | 1 | 1 |
| NHBA | 0 | 1 | 1 |
| HNAC | 0 | 0 | 0 |
| NA | 0 | 0 | 0 |
| HAA | 0 | 0 | 0 |
| HTOM | 0 | 0 | 0 |
| HAAC | 0 | 0 | 0 |
| NHNA | 0 | 0 | 0 |
| HIA | 0 | 0 | 0 |
| HNA | 0 | 0 | 0 |
| HBAC | 0 | 0 | 0 |
| HBA | 0 | 0 | 0 |
| HIAC | 0 | 0 | 0 |
• Cascade County population
52.9 mi,  291°
291°
• Lewis and Clark County
97.9 mi,  273°
273°
• Fergus County
52.5 mi,  75°
75°
• Chouteau County
59.3 mi,  354°
354°
• Broadwater County
74.5 mi,  229°
229°
• Musselshell County
95.5 mi,  112°
112°
• Sweet Grass County
86 mi,  168°
168°
• Wheatland County
42.6 mi,  150°
150°
• Meagher County
42.5 mi,  223°
223°
• Golden Valley County
70 mi,  130°
130°
[0] Calculated by population.us from last known population growth rate, not official data.
[1] County population - 2014, archived from the original, retrieved 02/23/2016
[1b] Annual County Resident Population Estimates by Age, Sex, Race, and Hispanic Origin, (used only data for 2014) archived from the original, retrieved 02/23/2016
[2] County population - 2000-2010, archived from the original, retrieved 02/23/2016
[3] Population of States and Counties of the United States: 1790 to 1992, PDF, 15 Mb, census.gov, retrieved 02/23/2016
[4] County area, latitude longitude data, retrieved 02/23/2016
[5] County boundaries, CSV files on boundaries.us, retrived 03/18/2016
*Fergus, Cascade Montana Notes
Page generated in 0.02 seconds© 2016 population.us | Terms of use | Contact