Last official estimated population of Jefferson County was 19,121 (year 2014)[1]. This was 0.006% of total US population and 0.7% of total Kansas state population. Area of Jefferson County is 556.7 mi² (=1441.8 km²), in this year population density was 34.35 p/mi². If population growth rate would be same as in period 2010-2014 (-0.01%/yr), Jefferson County population in 2026 would be 19,106 [0].
Historical population of Jefferson County for period 1860-2014 [1] , [2] , [3]:
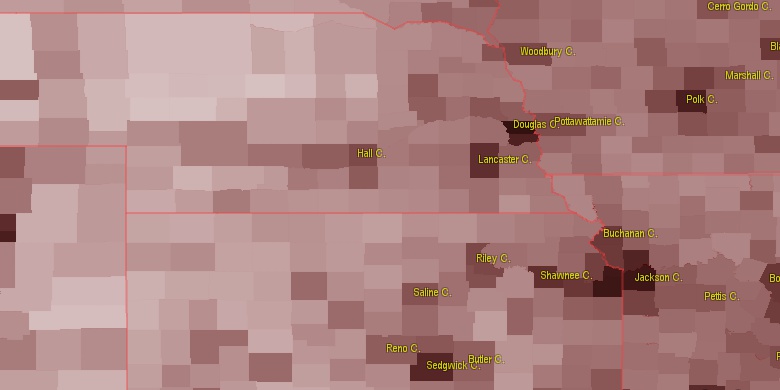
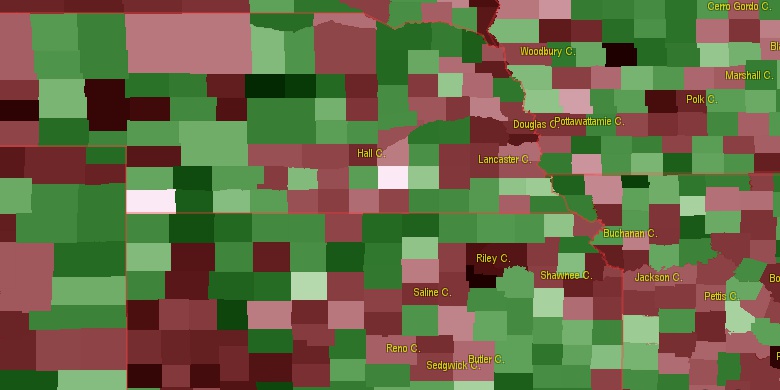
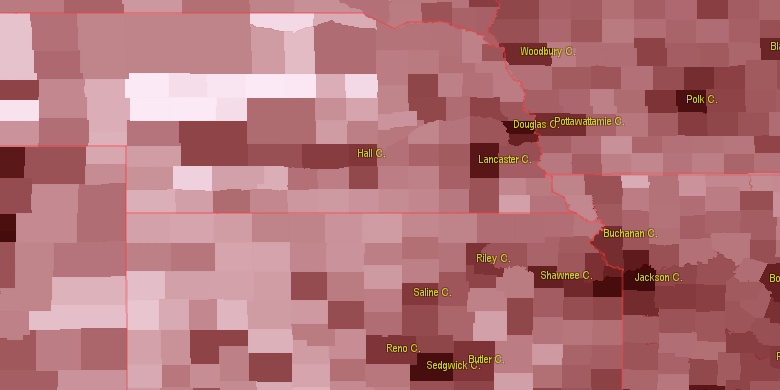
Estimated population for 2014[1]. Population density is in p./sq.mi [4]. Changes are for period 2010-2015. Value is %/year. Boundary lines are approx. 2012 [5]. Click on flag to hide it.
Population • Density • Changes • Legends • Position

[1860-1870] +10.88 %/yr
[1870-1880] +2.19 %/yr
[1880-1890] +0.66 %/yr
[1890-1900] +0.54 %/yr
[1900-1910] -1.02 %/yr
[1910-1920] -0.7 %/yr
[1920-1930] -0.43 %/yr
[1930-1940] -1.05 %/yr
[1940-1950] -1.37 %/yr
[1950-1960] +0.15 %/yr
[1960-1970] +0.6 %/yr
[1970-1980] +2.44 %/yr
[1980-1990] +0.45 %/yr
[1990-2000] +1.5 %/yr
[2000-2005] +0.76 %/yr
[2005-2010] -0.03 %/yr
[2010-2014] -0.01 %/yr
Looking for settlements in Jefferson County? Visit this page: Settlements in Jefferson County, KS
Population of Jefferson County by age groups male (M) and female (F)[1b]
| Age Gr. | (M) | (F) | Total |
| 0 to 4 | 507 | 488 | 995 |
| 5 to 9 | 613 | 593 | 1,206 |
| 10 to 14 | 710 | 656 | 1,366 |
| 15 to 19 | 707 | 596 | 1,303 |
| 20 to 24 | 478 | 402 | 880 |
| 25 to 29 | 436 | 472 | 908 |
| 30 to 34 | 491 | 495 | 986 |
| 35 to 39 | 524 | 480 | 1,004 |
| 40 to 44 | 527 | 566 | 1,093 |
| 45 to 49 | 653 | 669 | 1,322 |
| 50 to 54 | 830 | 854 | 1,684 |
| 55 to 59 | 788 | 744 | 1,532 |
| 60 to 64 | 683 | 643 | 1,326 |
| 65 to 69 | 551 | 521 | 1,072 |
| 70 to 74 | 394 | 382 | 776 |
| 75 to 79 | 281 | 308 | 589 |
| 80 to 84 | 192 | 192 | 384 |
| 85+ | 167 | 262 | 429 |
Jefferson County resident population estimates by Sex, Race, and Hispanic Origin[1b]. For full list of abbrevations see: population.us/about page.
| Race | Male | Female | Total |
| WAC | 9307 | 9143 | 18,450 |
| NH | 9275 | 9093 | 18,368 |
| WA | 9141 | 8956 | 18,097 |
| NHWAC | 9069 | 8927 | 17,996 |
| NHWA | 8926 | 8769 | 17,695 |
| H | 257 | 230 | 487 |
| HWAC | 238 | 216 | 454 |
| IAC | 221 | 226 | 447 |
| HWA | 215 | 187 | 402 |
| NHIAC | 195 | 194 | 389 |
| TOM | 173 | 189 | 362 |
| NHTOM | 149 | 160 | 309 |
| BAC | 135 | 96 | 231 |
| NHBAC | 122 | 87 | 209 |
| IA | 108 | 96 | 204 |
| NHIA | 98 | 86 | 184 |
| BA | 91 | 52 | 143 |
| NHBA | 84 | 48 | 132 |
| AAC | 35 | 43 | 78 |
| NHAAC | 31 | 41 | 72 |
| HIAC | 26 | 32 | 58 |
| HTOM | 24 | 29 | 53 |
| AA | 15 | 25 | 40 |
| NHAA | 14 | 25 | 39 |
| HBAC | 13 | 9 | 22 |
| HIA | 10 | 10 | 20 |
| NAC | 10 | 9 | 19 |
| NHNAC | 9 | 9 | 18 |
| HBA | 7 | 4 | 11 |
| NHNA | 4 | 5 | 9 |
| NA | 4 | 5 | 9 |
| HAAC | 4 | 2 | 6 |
| HNAC | 1 | 0 | 1 |
| HAA | 1 | 0 | 1 |
| HNA | 0 | 0 | 0 |
• Johnson County population
38.5 mi,  129°
129°
• Shawnee County
24.5 mi,  236°
236°
• Wyandotte County
33.9 mi,  104°
104°
• Douglas County
24.1 mi,  169°
169°
• Platte County
34.2 mi,  73°
73°
• Leavenworth County
18.3 mi, 100°
• Atchison County
20.5 mi,  9°
9°
• Jackson County
25.3 mi,  297°
297°
• Brown County
41.8 mi,  345°
345°
• Doniphan County
39.8 mi,  17°
17°
[0] Calculated by population.us from last known population growth rate, not official data.
[1] County population - 2014, archived from the original, retrieved 02/23/2016
[1b] Annual County Resident Population Estimates by Age, Sex, Race, and Hispanic Origin, (used only data for 2014) archived from the original, retrieved 02/23/2016
[2] County population - 2000-2010, archived from the original, retrieved 02/23/2016
[3] Population of States and Counties of the United States: 1790 to 1992, PDF, 15 Mb, census.gov, retrieved 02/23/2016
[4] County area, latitude longitude data, retrieved 02/23/2016
[5] County boundaries, CSV files on boundaries.us, retrived 03/18/2016
Page generated in 0.012 seconds© 2016 population.us | Terms of use | Contact