Last official estimated population of Decatur County was 2,949 (year 2014)[1]. This was 0.001% of total US population and 0.1% of total Kansas state population. Area of Decatur County is 894.1 mi² (=2315.8 km²), in this year population density was 3.30 p/mi². If population growth rate would be same as in period 2010-2014 (-0.1%/yr), Decatur County population in 2026 would be 2,913 [0].
Historical population of Decatur County for period 1880-2014 [1] , [2] , [3]:
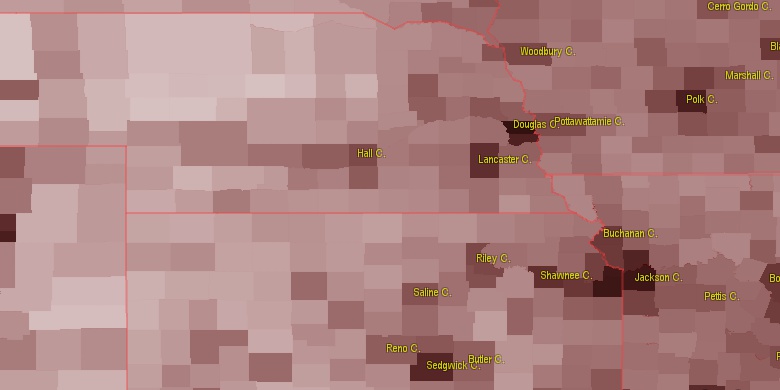
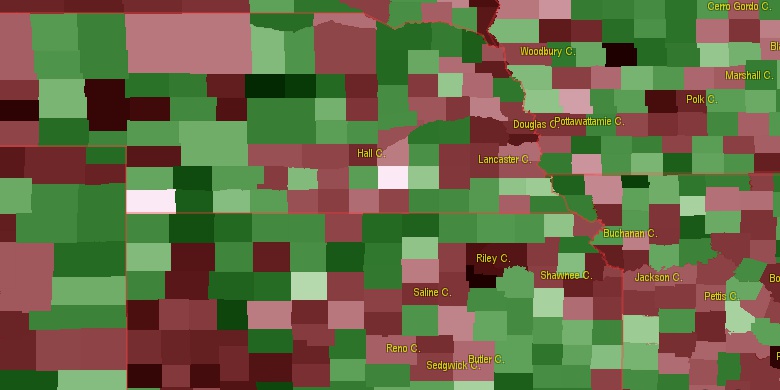
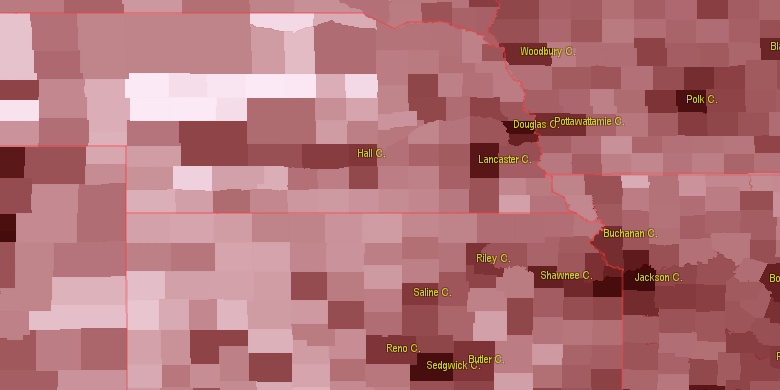
Estimated population for 2014[1]. Population density is in p./sq.mi [4]. Changes are for period 2010-2015. Value is %/year. Boundary lines are approx. 2012 [5]. Click on flag to hide it.
Population • Density • Changes • Legends • Position

[1880-1890] +7.25 %/yr
[1890-1900] +0.93 %/yr
[1900-1910] -0.28 %/yr
[1910-1920] -1 %/yr
[1920-1930] +0.88 %/yr
[1930-1940] -1.75 %/yr
[1940-1950] -1.82 %/yr
[1950-1960] -0.68 %/yr
[1960-1970] -1.46 %/yr
[1970-1980] -1 %/yr
[1980-1990] -1.14 %/yr
[1990-2000] -1.46 %/yr
[2000-2005] -2.07 %/yr
[2005-2010] -1.09 %/yr
[2010-2014] -0.1 %/yr
Looking for settlements in Decatur County? Visit this page: Settlements in Decatur County, KS
Population of Decatur County by age groups male (M) and female (F)[1b]
| Age Gr. | (M) | (F) | Total |
| 0 to 4 | 104 | 83 | 187 |
| 5 to 9 | 82 | 61 | 143 |
| 10 to 14 | 72 | 85 | 157 |
| 15 to 19 | 78 | 76 | 154 |
| 20 to 24 | 60 | 51 | 111 |
| 25 to 29 | 75 | 71 | 146 |
| 30 to 34 | 81 | 61 | 142 |
| 35 to 39 | 65 | 59 | 124 |
| 40 to 44 | 53 | 51 | 104 |
| 45 to 49 | 84 | 75 | 159 |
| 50 to 54 | 109 | 96 | 205 |
| 55 to 59 | 134 | 122 | 256 |
| 60 to 64 | 119 | 113 | 232 |
| 65 to 69 | 99 | 91 | 190 |
| 70 to 74 | 81 | 76 | 157 |
| 75 to 79 | 71 | 68 | 139 |
| 80 to 84 | 52 | 79 | 131 |
| 85+ | 52 | 119 | 171 |
Decatur County resident population estimates by Sex, Race, and Hispanic Origin[1b]. For full list of abbrevations see: population.us/about page.
| Race | Male | Female | Total |
| WAC | 1454 | 1407 | 2,861 |
| NH | 1434 | 1416 | 2,850 |
| WA | 1437 | 1383 | 2,820 |
| NHWAC | 1417 | 1386 | 2,803 |
| NHWA | 1401 | 1362 | 2,763 |
| H | 37 | 21 | 58 |
| HWAC | 37 | 21 | 58 |
| HWA | 36 | 21 | 57 |
| BAC | 18 | 30 | 48 |
| NHBAC | 18 | 30 | 48 |
| TOM | 17 | 26 | 43 |
| NHTOM | 16 | 26 | 42 |
| IAC | 11 | 18 | 29 |
| NHIAC | 10 | 18 | 28 |
| BA | 11 | 14 | 25 |
| NHBA | 11 | 14 | 25 |
| NHAAC | 5 | 10 | 15 |
| AAC | 5 | 10 | 15 |
| AA | 3 | 7 | 10 |
| IA | 3 | 7 | 10 |
| NHIA | 3 | 7 | 10 |
| NHAA | 3 | 7 | 10 |
| HTOM | 1 | 0 | 1 |
| HIAC | 1 | 0 | 1 |
| NAC | 0 | 1 | 1 |
| NHNAC | 0 | 1 | 1 |
| HNAC | 0 | 0 | 0 |
| NA | 0 | 0 | 0 |
| NHNA | 0 | 0 | 0 |
| HBAC | 0 | 0 | 0 |
| HBA | 0 | 0 | 0 |
| HAAC | 0 | 0 | 0 |
| HAA | 0 | 0 | 0 |
| HNA | 0 | 0 | 0 |
| HIA | 0 | 0 | 0 |
• Red Willow County population
26.7 mi,  358°
358°
• Thomas County
44.4 mi,  228°
228°
• Norton County
29.8 mi,  89°
89°
• Phillips County
59.3 mi, 89°
• Furnas County
40.5 mi,  45°
45°
• Hitchcock County
41.2 mi,  311°
311°
• Frontier County
51.7 mi,  3°
3°
• Graham County
42.8 mi,  133°
133°
• Sheridan County
29.9 mi,  178°
178°
• Rawlins County
32.8 mi,  270°
270°
[0] Calculated by population.us from last known population growth rate, not official data.
[1] County population - 2014, archived from the original, retrieved 02/23/2016
[1b] Annual County Resident Population Estimates by Age, Sex, Race, and Hispanic Origin, (used only data for 2014) archived from the original, retrieved 02/23/2016
[2] County population - 2000-2010, archived from the original, retrieved 02/23/2016
[3] Population of States and Counties of the United States: 1790 to 1992, PDF, 15 Mb, census.gov, retrieved 02/23/2016
[4] County area, latitude longitude data, retrieved 02/23/2016
[5] County boundaries, CSV files on boundaries.us, retrived 03/18/2016
Page generated in 0.065 seconds© 2016 population.us | Terms of use | Contact