Last official estimated population of Phillips County was 5,632 (year 2014)[1]. This was 0.002% of total US population and 0.2% of total Kansas state population. Area of Phillips County is 894.6 mi² (=2316.9 km²), in this year population density was 6.30 p/mi². If population growth rate would be same as in period 2010-2014 (-0.04%/yr), Phillips County population in 2026 would be 5,602 [0].
Historical population of Phillips County for period 1880-2014 [1] , [2] , [3]:
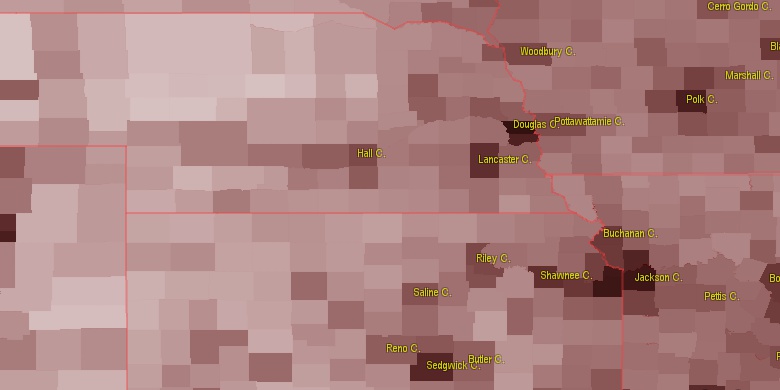
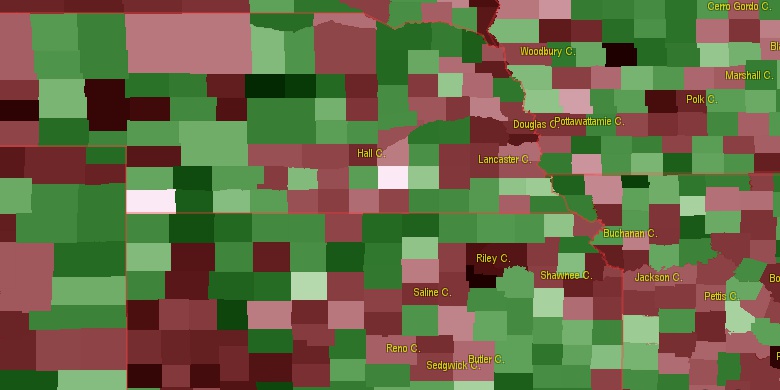
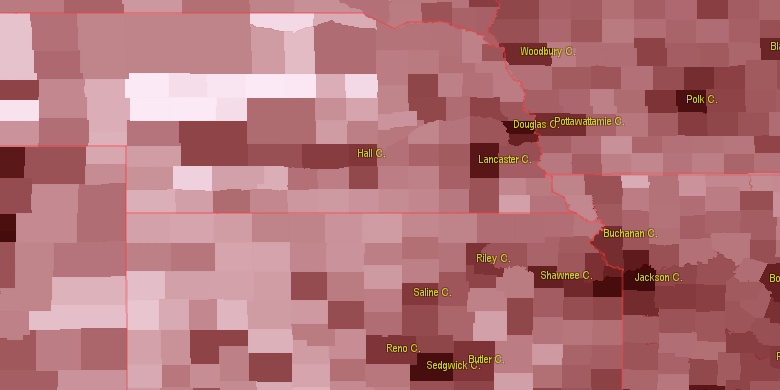
Estimated population for 2014[1]. Population density is in p./sq.mi [4]. Changes are for period 2010-2015. Value is %/year. Boundary lines are approx. 2012 [5]. Click on flag to hide it.
Population • Density • Changes • Legends • Position

[1880-1890] +1.29 %/yr
[1890-1900] +0.56 %/yr
[1900-1910] -0.2 %/yr
[1910-1920] -1.23 %/yr
[1920-1930] -0.28 %/yr
[1930-1940] -1.52 %/yr
[1940-1950] -1.17 %/yr
[1950-1960] -0.63 %/yr
[1960-1970] -0.99 %/yr
[1970-1980] -0.63 %/yr
[1980-1990] -1.16 %/yr
[1990-2000] -0.94 %/yr
[2000-2005] -1.21 %/yr
[2005-2010] 0 %/yr
[2010-2014] -0.04 %/yr
Looking for settlements in Phillips County? Visit this page: Settlements in Phillips County, KS
Population of Phillips County by age groups male (M) and female (F)[1b]
| Age Gr. | (M) | (F) | Total |
| 0 to 4 | 184 | 178 | 362 |
| 5 to 9 | 171 | 171 | 342 |
| 10 to 14 | 192 | 197 | 389 |
| 15 to 19 | 169 | 175 | 344 |
| 20 to 24 | 132 | 142 | 274 |
| 25 to 29 | 132 | 126 | 258 |
| 30 to 34 | 163 | 156 | 319 |
| 35 to 39 | 142 | 118 | 260 |
| 40 to 44 | 127 | 139 | 266 |
| 45 to 49 | 152 | 138 | 290 |
| 50 to 54 | 191 | 221 | 412 |
| 55 to 59 | 225 | 185 | 410 |
| 60 to 64 | 209 | 215 | 424 |
| 65 to 69 | 191 | 162 | 353 |
| 70 to 74 | 124 | 131 | 255 |
| 75 to 79 | 104 | 112 | 216 |
| 80 to 84 | 66 | 112 | 178 |
| 85+ | 53 | 128 | 181 |
Phillips County resident population estimates by Sex, Race, and Hispanic Origin[1b]. For full list of abbrevations see: population.us/about page.
| Race | Male | Female | Total |
| WAC | 2677 | 2752 | 5,429 |
| NH | 2652 | 2717 | 5,369 |
| WA | 2650 | 2717 | 5,367 |
| NHWAC | 2605 | 2670 | 5,275 |
| NHWA | 2581 | 2643 | 5,224 |
| H | 75 | 89 | 164 |
| HWAC | 72 | 82 | 154 |
| HWA | 69 | 74 | 143 |
| TOM | 30 | 38 | 68 |
| AAC | 30 | 32 | 62 |
| NHAAC | 30 | 31 | 61 |
| BAC | 31 | 26 | 57 |
| NHTOM | 27 | 29 | 56 |
| IAC | 20 | 34 | 54 |
| NHBAC | 28 | 19 | 47 |
| NHAA | 20 | 25 | 45 |
| AA | 20 | 25 | 45 |
| NHIAC | 16 | 26 | 42 |
| BA | 17 | 11 | 28 |
| NHBA | 16 | 10 | 26 |
| IA | 10 | 15 | 25 |
| NHIA | 8 | 10 | 18 |
| HIAC | 4 | 8 | 12 |
| HTOM | 3 | 9 | 12 |
| HBAC | 3 | 7 | 10 |
| HIA | 2 | 5 | 7 |
| NHNAC | 1 | 1 | 2 |
| HBA | 1 | 1 | 2 |
| NAC | 1 | 1 | 2 |
| HAAC | 0 | 1 | 1 |
| HNAC | 0 | 0 | 0 |
| NA | 0 | 0 | 0 |
| NHNA | 0 | 0 | 0 |
| HAA | 0 | 0 | 0 |
| HNA | 0 | 0 | 0 |
• Phelps County population
50.7 mi,  356°
356°
• Norton County
29.6 mi,  269°
269°
• Rooks County
30.3 mi,  178°
178°
• Furnas County
41.2 mi,  313°
313°
• Smith County
29.6 mi,  89°
89°
• Osborne County
42.9 mi,  134°
134°
• Webster County
52.4 mi,  58°
58°
• Harlan County
27.4 mi,  353°
353°
• Franklin County
34.1 mi,  36°
36°
• Graham County
41.2 mi,  223°
223°
[0] Calculated by population.us from last known population growth rate, not official data.
[1] County population - 2014, archived from the original, retrieved 02/23/2016
[1b] Annual County Resident Population Estimates by Age, Sex, Race, and Hispanic Origin, (used only data for 2014) archived from the original, retrieved 02/23/2016
[2] County population - 2000-2010, archived from the original, retrieved 02/23/2016
[3] Population of States and Counties of the United States: 1790 to 1992, PDF, 15 Mb, census.gov, retrieved 02/23/2016
[4] County area, latitude longitude data, retrieved 02/23/2016
[5] County boundaries, CSV files on boundaries.us, retrived 03/18/2016
Page generated in 0.018 seconds© 2016 population.us | Terms of use | Contact