Last official estimated population of Lauderdale County was 27,760 (year 2014)[1]. This was 0.009% of total US population and 0.4% of total Tennessee state population. Area of Lauderdale County is 507.6 mi² (=1314.6 km²), in this year population density was 54.69 p/mi². If population growth rate would be same as in period 2010-2014 (-0.05%/yr), Lauderdale County population in 2026 would be 27,596 [0].
Historical population of Lauderdale County for period 1840-2014 [1] , [2] , [3]:
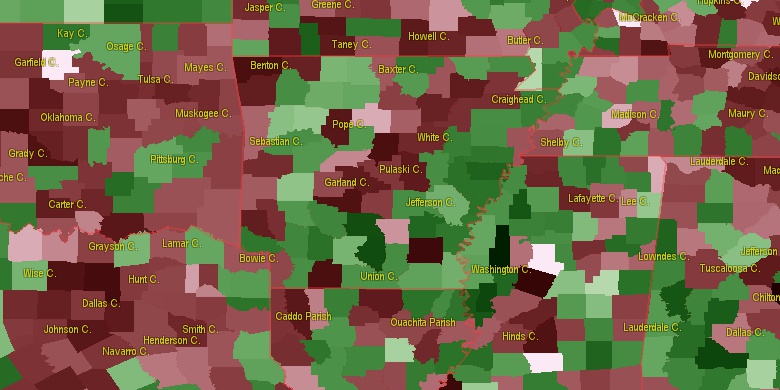
Estimated population for 2014[1]. Population density is in p./sq.mi [4]. Changes are for period 2010-2015. Value is %/year. Boundary lines are approx. 2012 [5]. Click on flag to hide it.
Population • Density • Changes • Legends • Position


[1840-1850] +4.17 %/yr
[1850-1860] +3.87 %/yr
[1860-1870] +3.67 %/yr
[1870-1880] +3.25 %/yr
[1880-1890] +2.32 %/yr
[1890-1900] +1.59 %/yr
[1900-1910] -0.4 %/yr
[1910-1920] +0.18 %/yr
[1920-1930] +0.86 %/yr
[1930-1940] +0.44 %/yr
[1940-1950] +0.24 %/yr
[1950-1960] -1.36 %/yr
[1960-1970] -0.74 %/yr
[1970-1980] +1.94 %/yr
[1980-1990] -0.44 %/yr
[1990-2000] +1.45 %/yr
[2000-2005] +0.2 %/yr
[2005-2010] +0.3 %/yr
[2010-2014] -0.05 %/yr
Looking for settlements in Lauderdale County? Visit this page: Settlements in Lauderdale County, TN
Population of Lauderdale County by age groups male (M) and female (F)[1b]
| Age Gr. | (M) | (F) | Total |
| 0 to 4 | 739 | 785 | 1,524 |
| 5 to 9 | 916 | 907 | 1,823 |
| 10 to 14 | 973 | 906 | 1,879 |
| 15 to 19 | 900 | 824 | 1,724 |
| 20 to 24 | 1186 | 769 | 1,955 |
| 25 to 29 | 1128 | 786 | 1,914 |
| 30 to 34 | 1203 | 818 | 2,021 |
| 35 to 39 | 1038 | 807 | 1,845 |
| 40 to 44 | 955 | 815 | 1,770 |
| 45 to 49 | 1046 | 830 | 1,876 |
| 50 to 54 | 979 | 977 | 1,956 |
| 55 to 59 | 877 | 904 | 1,781 |
| 60 to 64 | 706 | 840 | 1,546 |
| 65 to 69 | 629 | 684 | 1,313 |
| 70 to 74 | 484 | 500 | 984 |
| 75 to 79 | 270 | 395 | 665 |
| 80 to 84 | 160 | 238 | 398 |
| 85+ | 119 | 289 | 408 |
Lauderdale County resident population estimates by Sex, Race, and Hispanic Origin[1b]. For full list of abbrevations see: population.us/about page.
| Race | Male | Female | Total |
| NH | 13920 | 12833 | 26,753 |
| WAC | 8908 | 8505 | 17,413 |
| WA | 8760 | 8331 | 17,091 |
| NHWAC | 8625 | 8299 | 16,924 |
| NHWA | 8490 | 8137 | 16,627 |
| BAC | 5318 | 4512 | 9,830 |
| NHBAC | 5240 | 4479 | 9,719 |
| BA | 5206 | 4394 | 9,600 |
| NHBA | 5139 | 4367 | 9,506 |
| H | 388 | 241 | 629 |
| HWAC | 283 | 206 | 489 |
| HWA | 270 | 194 | 464 |
| TOM | 168 | 181 | 349 |
| NHTOM | 151 | 168 | 319 |
| IAC | 156 | 124 | 280 |
| NHIAC | 129 | 113 | 242 |
| AAC | 95 | 110 | 205 |
| NHAAC | 83 | 106 | 189 |
| IA | 106 | 78 | 184 |
| NHIA | 83 | 72 | 155 |
| AA | 65 | 90 | 155 |
| NHAA | 57 | 89 | 146 |
| HBAC | 78 | 33 | 111 |
| HBA | 67 | 27 | 94 |
| HIAC | 27 | 11 | 38 |
| HTOM | 17 | 13 | 30 |
| HIA | 23 | 6 | 29 |
| NAC | 14 | 9 | 23 |
| NHNAC | 8 | 9 | 17 |
| HAAC | 12 | 4 | 16 |
| HAA | 8 | 1 | 9 |
| HNAC | 6 | 0 | 6 |
| HNA | 3 | 0 | 3 |
| NA | 3 | 0 | 3 |
| NHNA | 0 | 0 | 0 |
• Tipton County population
19.8 mi,  203°
203°
• Gibson County
41.9 mi,  67°
67°
• Mississippi County
23.8 mi,  270°
270°
• Fayette County
40.9 mi,  162°
162°
• Dyer County
23.9 mi,  32°
32°
• Dunklin County
36.3 mi,  317°
317°
• Haywood County
22.9 mi,  122°
122°
• Pemiscot County
32.1 mi,  344°
344°
• Crockett County
28 mi,  82°
82°
• Lake County
40.2 mi,  11°
11°
[0] Calculated by population.us from last known population growth rate, not official data.
[1] County population - 2014, archived from the original, retrieved 02/23/2016
[1b] Annual County Resident Population Estimates by Age, Sex, Race, and Hispanic Origin, (used only data for 2014) archived from the original, retrieved 02/23/2016
[2] County population - 2000-2010, archived from the original, retrieved 02/23/2016
[3] Population of States and Counties of the United States: 1790 to 1992, PDF, 15 Mb, census.gov, retrieved 02/23/2016
[4] County area, latitude longitude data, retrieved 02/23/2016
[5] County boundaries, CSV files on boundaries.us, retrived 03/18/2016
See note 24 Tennessee Notes
Page generated in 0.016 seconds© 2016 population.us | Terms of use | Contact