Last official estimated population of Clarendon County was 34,949 (year 2014)[1]. This was 0.011% of total US population and 0.7% of total South Carolina state population. Area of Clarendon County is 695.7 mi² (=1801.7 km²), in this year population density was 50.24 p/mi². If population growth rate would be same as in period 2010-2014 (-0.02%/yr), Clarendon County population in 2026 would be 34,883 [0].
Historical population of Clarendon County for period 1790-2014 [1] , [2] , [3]:
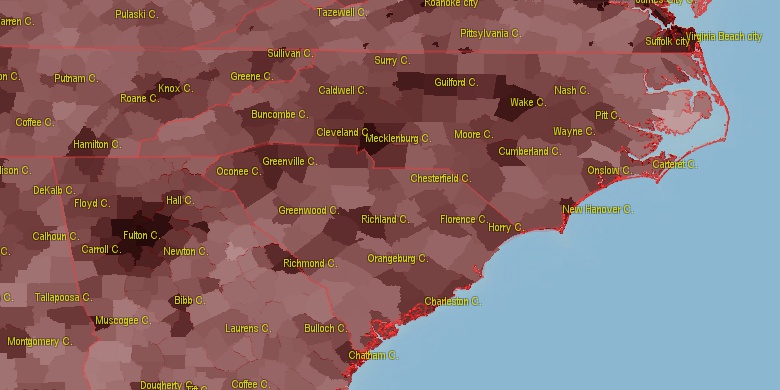
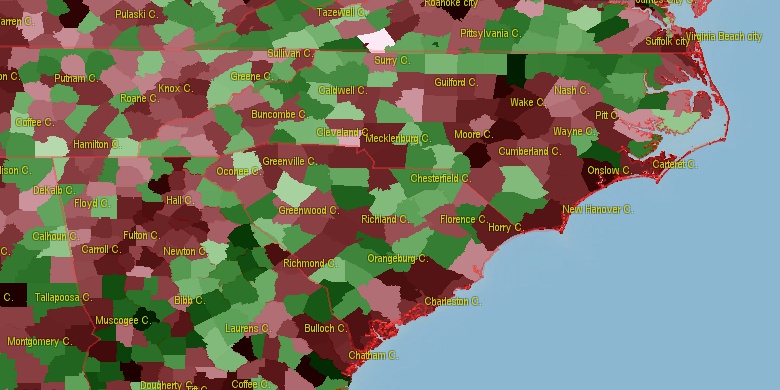
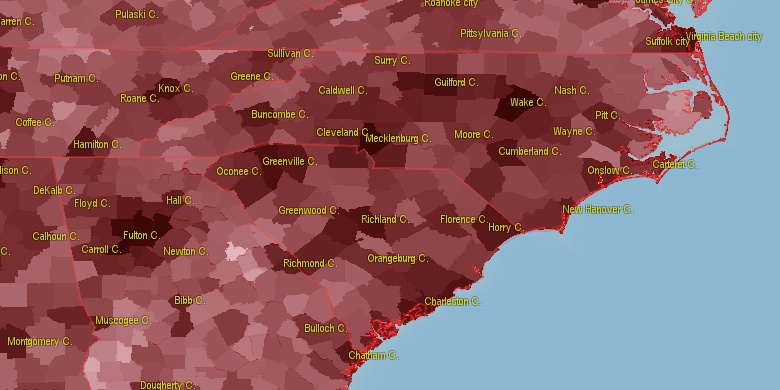
Estimated population for 2014[1]. Population density is in p./sq.mi [4]. Changes are for period 2010-2015. Value is %/year. Boundary lines are approx. 2012 [5]. Click on flag to hide it.
Population • Density • Changes • Legends • Position

[1790-1860] +2.46 %/yr
[1860-1870] +0.7 %/yr
[1870-1880] +3.18 %/yr
[1880-1890] +1.93 %/yr
[1890-1900] +1.95 %/yr
[1900-1910] +1.34 %/yr
[1910-1920] +0.81 %/yr
[1920-1930] -1.48 %/yr
[1930-1940] +0.48 %/yr
[1940-1950] +0.22 %/yr
[1950-1960] -0.88 %/yr
[1960-1970] -1.4 %/yr
[1970-1980] +0.7 %/yr
[1980-1990] +0.35 %/yr
[1990-2000] +1.33 %/yr
[2000-2005] +0.84 %/yr
[2005-2010] +0.66 %/yr
[2010-2014] -0.02 %/yr
Looking for settlements in Clarendon County? Visit this page: Settlements in Clarendon County, SC
Population of Clarendon County by age groups male (M) and female (F)[1b]
| Age Gr. | (M) | (F) | Total |
| 0 to 4 | 885 | 851 | 1,736 |
| 5 to 9 | 931 | 999 | 1,930 |
| 10 to 14 | 1029 | 1007 | 2,036 |
| 15 to 19 | 1179 | 937 | 2,116 |
| 20 to 24 | 1564 | 1037 | 2,601 |
| 25 to 29 | 1025 | 956 | 1,981 |
| 30 to 34 | 890 | 892 | 1,782 |
| 35 to 39 | 819 | 852 | 1,671 |
| 40 to 44 | 951 | 931 | 1,882 |
| 45 to 49 | 900 | 1079 | 1,979 |
| 50 to 54 | 1181 | 1274 | 2,455 |
| 55 to 59 | 1160 | 1447 | 2,607 |
| 60 to 64 | 1186 | 1391 | 2,577 |
| 65 to 69 | 1121 | 1298 | 2,419 |
| 70 to 74 | 878 | 926 | 1,804 |
| 75 to 79 | 579 | 664 | 1,243 |
| 80 to 84 | 337 | 400 | 737 |
| 85+ | 191 | 366 | 557 |
Clarendon County resident population estimates by Sex, Race, and Hispanic Origin[1b]. For full list of abbrevations see: population.us/about page.
| Race | Male | Female | Total |
| NH | 16260 | 16842 | 33,102 |
| WAC | 8590 | 8531 | 17,121 |
| WA | 8445 | 8410 | 16,855 |
| BAC | 8145 | 8657 | 16,802 |
| BA | 8041 | 8574 | 16,615 |
| NHBAC | 8028 | 8530 | 16,558 |
| NHBA | 7943 | 8455 | 16,398 |
| NHWAC | 8165 | 8204 | 16,369 |
| NHWA | 8040 | 8097 | 16,137 |
| H | 546 | 465 | 1,011 |
| HWAC | 425 | 327 | 752 |
| HWA | 405 | 313 | 718 |
| TOM | 169 | 142 | 311 |
| AAC | 129 | 144 | 273 |
| NHTOM | 146 | 126 | 272 |
| NHAAC | 122 | 140 | 262 |
| HBAC | 117 | 127 | 244 |
| AA | 100 | 117 | 217 |
| HBA | 98 | 119 | 217 |
| IAC | 106 | 105 | 211 |
| NHAA | 95 | 116 | 211 |
| NHIAC | 87 | 86 | 173 |
| IA | 48 | 57 | 105 |
| NHIA | 34 | 44 | 78 |
| HTOM | 23 | 16 | 39 |
| HIAC | 19 | 19 | 38 |
| NAC | 13 | 16 | 29 |
| HIA | 14 | 13 | 27 |
| NHNAC | 11 | 12 | 23 |
| HAAC | 7 | 4 | 11 |
| NA | 3 | 7 | 10 |
| HAA | 5 | 1 | 6 |
| HNAC | 2 | 4 | 6 |
| NHNA | 2 | 4 | 6 |
| HNA | 1 | 3 | 4 |
• Richland County population
46.4 mi,  302°
302°
• Berkeley County
35.1 mi,  154°
154°
• Dorchester County
41.7 mi,  194°
194°
• Florence County
38.5 mi,  49°
49°
• Sumter County
19.8 mi,  331°
331°
• Orangeburg County
37.2 mi,  244°
244°
• Darlington County
48.4 mi,  17°
17°
• Williamsburg County
29 mi,  95°
95°
• Lee County
34.2 mi,  356°
356°
• Calhoun County
32.3 mi,  271°
271°
[0] Calculated by population.us from last known population growth rate, not official data.
[1] County population - 2014, archived from the original, retrieved 02/23/2016
[1b] Annual County Resident Population Estimates by Age, Sex, Race, and Hispanic Origin, (used only data for 2014) archived from the original, retrieved 02/23/2016
[2] County population - 2000-2010, archived from the original, retrieved 02/23/2016
[3] Population of States and Counties of the United States: 1790 to 1992, PDF, 15 Mb, census.gov, retrieved 02/23/2016
[4] County area, latitude longitude data, retrieved 02/23/2016
[5] County boundaries, CSV files on boundaries.us, retrived 03/18/2016
See note 9 South Carolina Notes
Page generated in 0.029 seconds© 2016 population.us | Terms of use | Contact