Last official estimated population of Granite County was 3,073 (year 2014)[1]. This was 0.001% of total US population and 0.3% of total Montana state population. Area of Granite County is 1,732.8 mi² (=4487.8 km²), in this year population density was 1.77 p/mi². If population growth rate would be same as in period 2010-2014 (-0.05%/yr), Granite County population in 2026 would be 3,055 [0].
Historical population of Granite County for period 1900-2014 [1] , [2] , [3]:
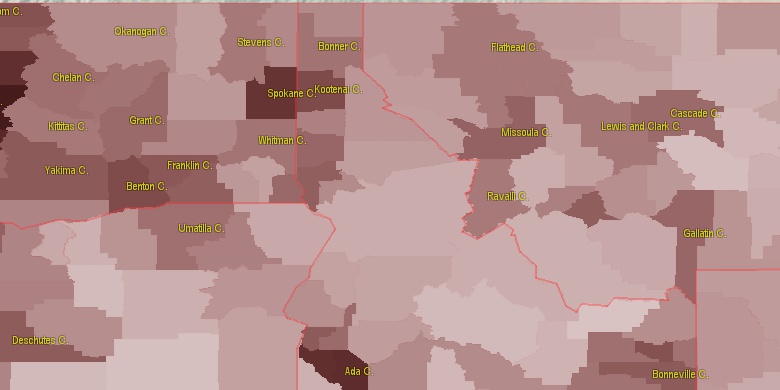
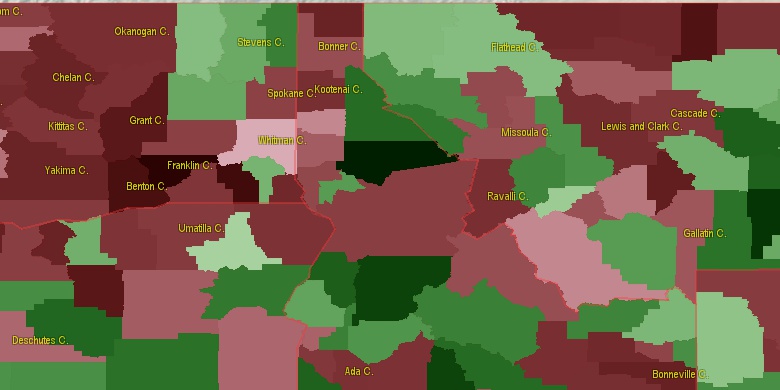
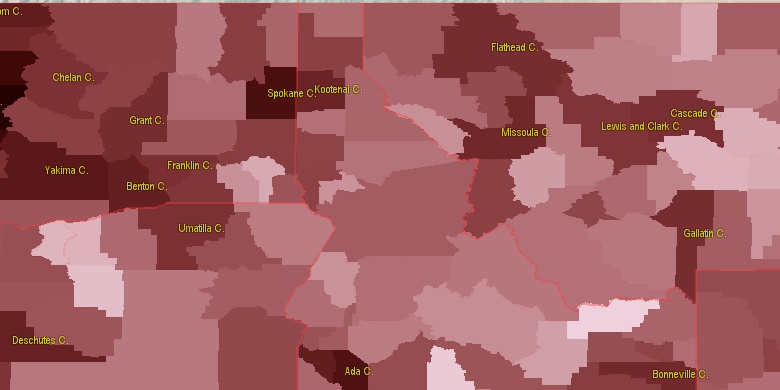
Estimated population for 2014[1]. Population density is in p./sq.mi [4]. Changes are for period 2010-2015. Value is %/year. Boundary lines are approx. 2012 [5]. Click on flag to hide it.
Population • Density • Changes • Legends • Position

[1900-1910] -3.79 %/yr
[1910-1920] +3.54 %/yr
[1920-1930] -3.19 %/yr
[1930-1940] +1.22 %/yr
[1940-1950] -2.02 %/yr
[1950-1960] +0.84 %/yr
[1960-1970] -0.96 %/yr
[1970-1980] -0.14 %/yr
[1980-1990] -0.58 %/yr
[1990-2000] +1.09 %/yr
[2000-2005] +1.16 %/yr
[2005-2010] +0.46 %/yr
[2010-2014] -0.05 %/yr
Looking for settlements in Granite County? Visit this page: Settlements in Granite County, MT
Population of Granite County by age groups male (M) and female (F)[1b]
| Age Gr. | (M) | (F) | Total |
| 0 to 4 | 52 | 63 | 115 |
| 5 to 9 | 75 | 56 | 131 |
| 10 to 14 | 66 | 97 | 163 |
| 15 to 19 | 75 | 84 | 159 |
| 20 to 24 | 54 | 52 | 106 |
| 25 to 29 | 48 | 53 | 101 |
| 30 to 34 | 79 | 70 | 149 |
| 35 to 39 | 70 | 74 | 144 |
| 40 to 44 | 84 | 73 | 157 |
| 45 to 49 | 67 | 79 | 146 |
| 50 to 54 | 138 | 128 | 266 |
| 55 to 59 | 156 | 164 | 320 |
| 60 to 64 | 172 | 154 | 326 |
| 65 to 69 | 155 | 129 | 284 |
| 70 to 74 | 139 | 123 | 262 |
| 75 to 79 | 94 | 84 | 178 |
| 80 to 84 | 51 | 44 | 95 |
| 85+ | 45 | 62 | 107 |
Granite County resident population estimates by Sex, Race, and Hispanic Origin[1b]. For full list of abbrevations see: population.us/about page.
| Race | Male | Female | Total |
| WAC | 1599 | 1560 | 3,159 |
| NH | 1585 | 1556 | 3,141 |
| WA | 1570 | 1526 | 3,096 |
| NHWAC | 1566 | 1527 | 3,093 |
| NHWA | 1540 | 1496 | 3,036 |
| IAC | 36 | 34 | 70 |
| H | 35 | 33 | 68 |
| TOM | 32 | 35 | 67 |
| HWAC | 33 | 33 | 66 |
| NHIAC | 33 | 31 | 64 |
| HWA | 30 | 30 | 60 |
| NHTOM | 28 | 32 | 60 |
| BAC | 7 | 16 | 23 |
| NHIA | 12 | 10 | 22 |
| IA | 12 | 10 | 22 |
| NHBAC | 6 | 16 | 22 |
| AAC | 9 | 12 | 21 |
| NHAAC | 7 | 12 | 19 |
| BA | 2 | 12 | 14 |
| NHBA | 2 | 12 | 14 |
| AA | 4 | 5 | 9 |
| NHAA | 3 | 5 | 8 |
| HTOM | 4 | 3 | 7 |
| HIAC | 3 | 3 | 6 |
| NAC | 1 | 2 | 3 |
| NHNAC | 1 | 2 | 3 |
| HAAC | 2 | 0 | 2 |
| HBAC | 1 | 0 | 1 |
| HAA | 1 | 0 | 1 |
| NHNA | 0 | 1 | 1 |
| NA | 0 | 1 | 1 |
| HNAC | 0 | 0 | 0 |
| HBA | 0 | 0 | 0 |
| HNA | 0 | 0 | 0 |
| HIA | 0 | 0 | 0 |
• Missoula County population
48.9 mi,  333°
333°
• Lewis and Clark County
70.4 mi,  44°
44°
• Ravalli County
39.6 mi,  236°
236°
• Silver Bow County
50.4 mi,  133°
133°
• Lake County
91.5 mi,  340°
340°
• Jefferson County
68 mi,  106°
106°
• Deer Lodge County
24.9 mi,  146°
146°
• Beaverhead County
90.9 mi,  163°
163°
• Powell County
38.9 mi, 37°
• Broadwater County
92.1 mi,  92°
92°
[0] Calculated by population.us from last known population growth rate, not official data.
[1] County population - 2014, archived from the original, retrieved 02/23/2016
[1b] Annual County Resident Population Estimates by Age, Sex, Race, and Hispanic Origin, (used only data for 2014) archived from the original, retrieved 02/23/2016
[2] County population - 2000-2010, archived from the original, retrieved 02/23/2016
[3] Population of States and Counties of the United States: 1790 to 1992, PDF, 15 Mb, census.gov, retrieved 02/23/2016
[4] County area, latitude longitude data, retrieved 02/23/2016
[5] County boundaries, CSV files on boundaries.us, retrived 03/18/2016
*Deer Lodge, Missoula; Silver Bow Montana Notes
Page generated in 0.02 seconds© 2016 population.us | Terms of use | Contact