Last official estimated population of Jasper County was 16,986 (year 2014)[1]. This was 0.005% of total US population and 0.6% of total Mississippi state population. Area of Jasper County is 677.5 mi² (=1754.6 km²), in this year population density was 25.07 p/mi². If population growth rate would be same as in period 2010-2014 (-0.11%/yr), Jasper County population in 2026 would be 16,760 [0].
Historical population of Jasper County for period 1840-2014 [1] , [2] , [3]:
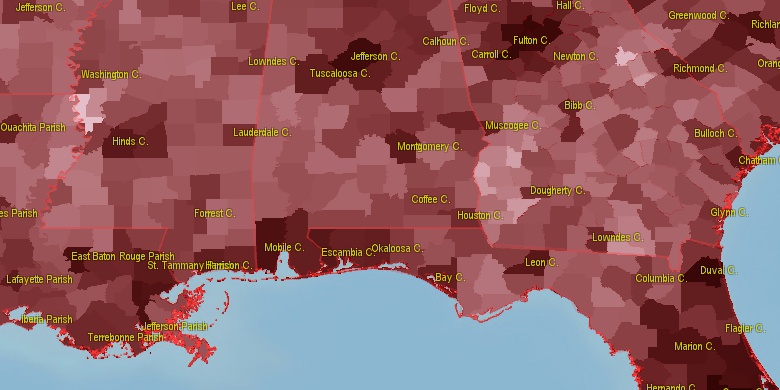
Estimated population for 2014[1]. Population density is in p./sq.mi [4]. Changes are for period 2010-2015. Value is %/year. Boundary lines are approx. 2012 [5]. Click on flag to hide it.
Population • Density • Changes • Legends • Position

[1840-1850] +4.56 %/yr
[1850-1860] +5.94 %/yr
[1860-1870] -0.11 %/yr
[1870-1880] +1.09 %/yr
[1880-1890] +2 %/yr
[1890-1900] +0.4 %/yr
[1900-1910] +1.85 %/yr
[1910-1920] +0.01 %/yr
[1920-1930] +0.07 %/yr
[1930-1940] +0.45 %/yr
[1940-1950] -0.3 %/yr
[1950-1960] -1.11 %/yr
[1960-1970] -0.55 %/yr
[1970-1980] +0.77 %/yr
[1980-1990] -0.09 %/yr
[1990-2000] +0.59 %/yr
[2000-2005] -0.73 %/yr
[2005-2010] -0.5 %/yr
[2010-2014] -0.11 %/yr
Looking for settlements in Jasper County? Visit this page: Settlements in Jasper County, MS
Population of Jasper County by age groups male (M) and female (F)[1b]
| Age Gr. | (M) | (F) | Total |
| 0 to 4 | 608 | 516 | 1,124 |
| 5 to 9 | 535 | 549 | 1,084 |
| 10 to 14 | 489 | 509 | 998 |
| 15 to 19 | 539 | 543 | 1,082 |
| 20 to 24 | 526 | 532 | 1,058 |
| 25 to 29 | 413 | 442 | 855 |
| 30 to 34 | 492 | 466 | 958 |
| 35 to 39 | 413 | 476 | 889 |
| 40 to 44 | 466 | 488 | 954 |
| 45 to 49 | 517 | 511 | 1,028 |
| 50 to 54 | 559 | 617 | 1,176 |
| 55 to 59 | 610 | 662 | 1,272 |
| 60 to 64 | 544 | 591 | 1,135 |
| 65 to 69 | 470 | 487 | 957 |
| 70 to 74 | 361 | 389 | 750 |
| 75 to 79 | 281 | 323 | 604 |
| 80 to 84 | 156 | 193 | 349 |
| 85+ | 108 | 220 | 328 |
Jasper County resident population estimates by Sex, Race, and Hispanic Origin[1b]. For full list of abbrevations see: population.us/about page.
| Race | Male | Female | Total |
| NH | 7968 | 8429 | 16,397 |
| BAC | 4197 | 4579 | 8,776 |
| NHBAC | 4159 | 4552 | 8,711 |
| BA | 4156 | 4541 | 8,697 |
| NHBA | 4121 | 4514 | 8,635 |
| WAC | 3873 | 3927 | 7,800 |
| WA | 3825 | 3874 | 7,699 |
| NHWAC | 3802 | 3874 | 7,676 |
| NHWA | 3757 | 3821 | 7,578 |
| H | 119 | 85 | 204 |
| HWAC | 71 | 53 | 124 |
| HWA | 68 | 53 | 121 |
| TOM | 62 | 59 | 121 |
| NHTOM | 58 | 59 | 117 |
| IAC | 41 | 36 | 77 |
| NHIAC | 32 | 34 | 66 |
| HBAC | 38 | 27 | 65 |
| HBA | 35 | 27 | 62 |
| AAC | 33 | 25 | 58 |
| NHAAC | 32 | 25 | 57 |
| AA | 20 | 17 | 37 |
| NHAA | 20 | 17 | 37 |
| IA | 18 | 15 | 33 |
| NHIA | 10 | 13 | 23 |
| NAC | 6 | 9 | 15 |
| NA | 6 | 8 | 14 |
| HIAC | 9 | 2 | 11 |
| HIA | 8 | 2 | 10 |
| NHNAC | 2 | 6 | 8 |
| HNAC | 4 | 3 | 7 |
| HNA | 4 | 3 | 7 |
| NHNA | 2 | 5 | 7 |
| HTOM | 4 | 0 | 4 |
| HAAC | 1 | 0 | 1 |
| HAA | 0 | 0 | 0 |
• Lauderdale County population
37.9 mi,  45°
45°
• Jones County
27.8 mi,  185°
185°
• Neshoba County
50.8 mi,  0°
0°
• Scott County
37.3 mi,  319°
319°
• Simpson County
47.5 mi,  260°
260°
• Newton County
26.6 mi, 0°
• Wayne County
36.6 mi,  134°
134°
• Covington County
36.6 mi,  223°
223°
• Clarke County
25.3 mi,  85°
85°
• Smith County
22 mi,  270°
270°
[0] Calculated by population.us from last known population growth rate, not official data.
[1] County population - 2014, archived from the original, retrieved 02/23/2016
[1b] Annual County Resident Population Estimates by Age, Sex, Race, and Hispanic Origin, (used only data for 2014) archived from the original, retrieved 02/23/2016
[2] County population - 2000-2010, archived from the original, retrieved 02/23/2016
[3] Population of States and Counties of the United States: 1790 to 1992, PDF, 15 Mb, census.gov, retrieved 02/23/2016
[4] County area, latitude longitude data, retrieved 02/23/2016
[5] County boundaries, CSV files on boundaries.us, retrived 03/18/2016
Page generated in 0.017 seconds© 2016 population.us | Terms of use | Contact


