Last official estimated population of Presque Isle County was 13,299 (year 2014)[1]. This was 0.004% of total US population and 0.1% of total Michigan state population. Area of Presque Isle County is 2,572.8 mi² (=6663.4 km²), in this year population density was 5.17 p/mi². If population growth rate would be same as in period 2010-2014 (-0.14%/yr), Presque Isle County population in 2026 would be 13,071 [0].
Historical population of Presque Isle County for period 1860-2014 [1] , [2] , [3]:
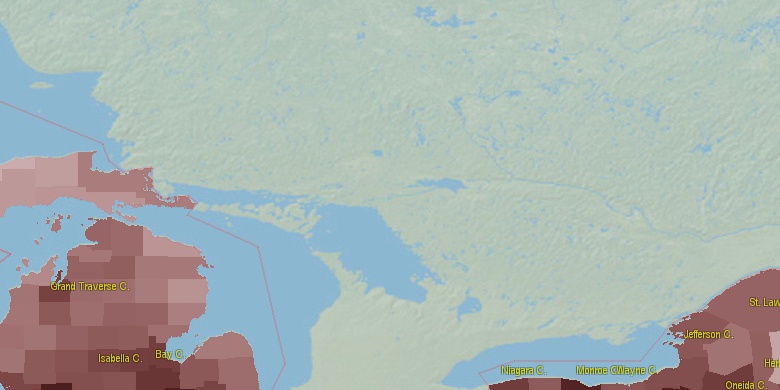
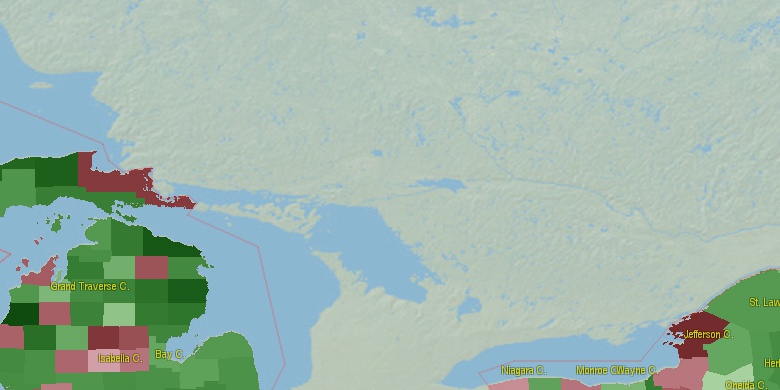
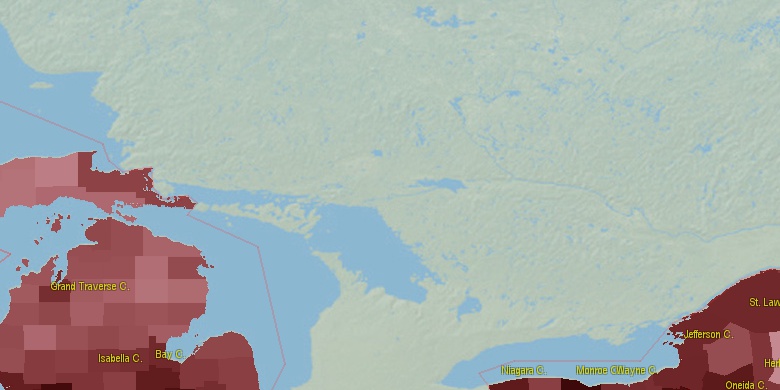
Estimated population for 2014[1]. Population density is in p./sq.mi [4]. Changes are for period 2010-2015. Value is %/year. Boundary lines are approx. 2012 [5]. Click on flag to hide it.
Population • Density • Changes • Legends • Position

[1860-1870] +29.87 %/yr
[1870-1880] +24.25 %/yr
[1880-1890] +4.18 %/yr
[1890-1900] +6.53 %/yr
[1900-1910] +2.46 %/yr
[1910-1920] +0.76 %/yr
[1920-1930] -0.68 %/yr
[1930-1940] +0.78 %/yr
[1940-1950] -0.21 %/yr
[1950-1960] +0.9 %/yr
[1960-1970] -0.22 %/yr
[1970-1980] +1.06 %/yr
[1980-1990] -0.37 %/yr
[1990-2000] +0.48 %/yr
[2000-2005] -0.45 %/yr
[2005-2010] -1.05 %/yr
[2010-2014] -0.14 %/yr
Looking for settlements in Presque Isle County? Visit this page: Settlements in Presque Isle County, MI
Population of Presque Isle County by age groups male (M) and female (F)[1b]
| Age Gr. | (M) | (F) | Total |
| 0 to 4 | 227 | 243 | 470 |
| 5 to 9 | 262 | 278 | 540 |
| 10 to 14 | 318 | 345 | 663 |
| 15 to 19 | 346 | 342 | 688 |
| 20 to 24 | 281 | 250 | 531 |
| 25 to 29 | 225 | 205 | 430 |
| 30 to 34 | 264 | 265 | 529 |
| 35 to 39 | 260 | 266 | 526 |
| 40 to 44 | 322 | 306 | 628 |
| 45 to 49 | 356 | 349 | 705 |
| 50 to 54 | 512 | 523 | 1,035 |
| 55 to 59 | 590 | 603 | 1,193 |
| 60 to 64 | 682 | 654 | 1,336 |
| 65 to 69 | 574 | 523 | 1,097 |
| 70 to 74 | 458 | 457 | 915 |
| 75 to 79 | 346 | 333 | 679 |
| 80 to 84 | 246 | 267 | 513 |
| 85+ | 210 | 316 | 526 |
Presque Isle County resident population estimates by Sex, Race, and Hispanic Origin[1b]. For full list of abbrevations see: population.us/about page.
| Race | Male | Female | Total |
| NH | 6400 | 6454 | 12,854 |
| WAC | 6347 | 6397 | 12,744 |
| NHWAC | 6281 | 6337 | 12,618 |
| WA | 6290 | 6326 | 12,616 |
| NHWA | 6227 | 6269 | 12,496 |
| IAC | 105 | 99 | 204 |
| NHIAC | 93 | 91 | 184 |
| H | 79 | 71 | 150 |
| TOM | 59 | 75 | 134 |
| NHTOM | 56 | 71 | 127 |
| HWAC | 66 | 60 | 126 |
| IA | 71 | 52 | 123 |
| HWA | 63 | 57 | 120 |
| BAC | 62 | 56 | 118 |
| NHBAC | 61 | 53 | 114 |
| NHIA | 61 | 46 | 107 |
| NHBA | 41 | 34 | 75 |
| BA | 41 | 34 | 75 |
| AAC | 28 | 46 | 74 |
| NHAAC | 24 | 43 | 67 |
| AA | 18 | 36 | 54 |
| NHAA | 15 | 33 | 48 |
| HIAC | 12 | 8 | 20 |
| HIA | 10 | 6 | 16 |
| HAAC | 4 | 3 | 7 |
| HTOM | 3 | 4 | 7 |
| HAA | 3 | 3 | 6 |
| HBAC | 1 | 3 | 4 |
| NAC | 0 | 3 | 3 |
| NHNAC | 0 | 2 | 2 |
| NA | 0 | 2 | 2 |
| HNAC | 0 | 1 | 1 |
| NHNA | 0 | 1 | 1 |
| HNA | 0 | 1 | 1 |
| HBA | 0 | 0 | 0 |
• Chippewa County population
79.3 mi,  316°
316°
• Emmet County
77.9 mi,  275°
275°
• Alpena County
41.1 mi,  182°
182°
• Cheboygan County
53.8 mi,  269°
269°
• Iosco County
84.3 mi,  161°
161°
• Otsego County
66.4 mi,  240°
240°
• Crawford County
81.9 mi,  226°
226°
• Alcona County
61.9 mi,  154°
154°
• Montmorency County
48.5 mi, 228°
• Oscoda County
66.2 mi,  213°
213°
[0] Calculated by population.us from last known population growth rate, not official data.
[1] County population - 2014, archived from the original, retrieved 02/23/2016
[1b] Annual County Resident Population Estimates by Age, Sex, Race, and Hispanic Origin, (used only data for 2014) archived from the original, retrieved 02/23/2016
[2] County population - 2000-2010, archived from the original, retrieved 02/23/2016
[3] Population of States and Counties of the United States: 1790 to 1992, PDF, 15 Mb, census.gov, retrieved 02/23/2016
[4] County area, latitude longitude data, retrieved 02/23/2016
[5] County boundaries, CSV files on boundaries.us, retrived 03/18/2016
*Mackinac Michigan Notes
Page generated in 0.015 seconds© 2016 population.us | Terms of use | Contact