Last official estimated population of Ottawa County was 6,093 (year 2014)[1]. This was 0.002% of total US population and 0.2% of total Kansas state population. Area of Ottawa County is 721.3 mi² (=1868.3 km²), in this year population density was 8.45 p/mi². If population growth rate would be same as in period 2010-2014 (+0.01%/yr), Ottawa County population in 2026 would be 6,099 [0].
Historical population of Ottawa County for period 1870-2014 [1] , [2] , [3]:
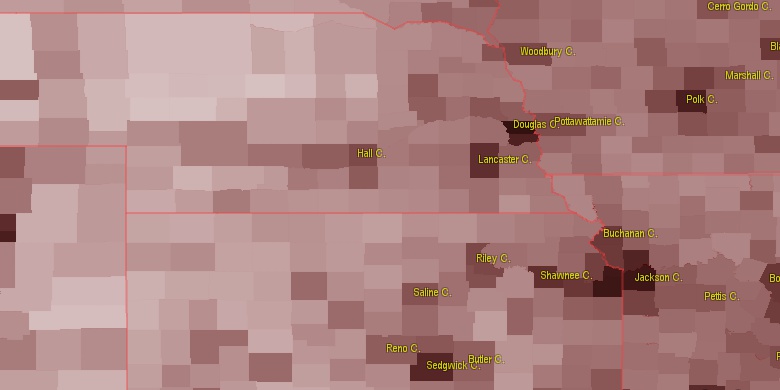
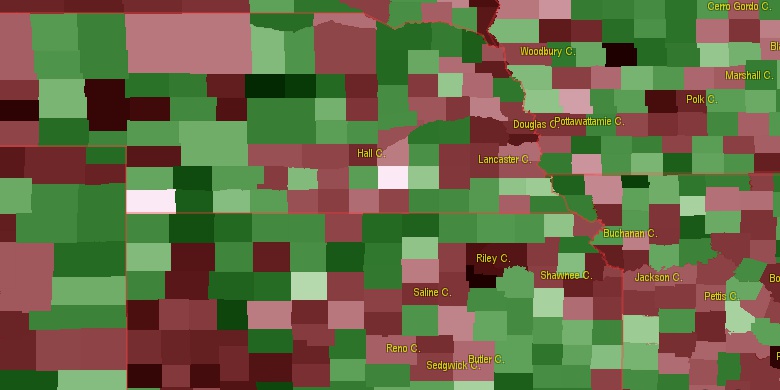
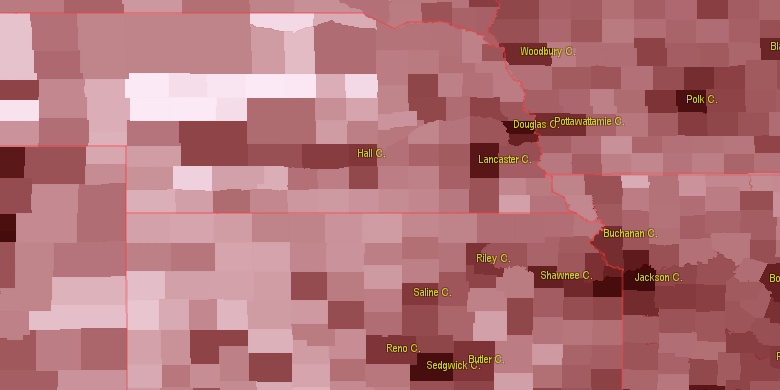
Estimated population for 2014[1]. Population density is in p./sq.mi [4]. Changes are for period 2010-2015. Value is %/year. Boundary lines are approx. 2012 [5]. Click on flag to hide it.
Population • Density • Changes • Legends • Position

[1870-1880] +17.09 %/yr
[1880-1890] +2.01 %/yr
[1890-1900] -1.17 %/yr
[1900-1910] +0.55 %/yr
[1910-1920] -0.97 %/yr
[1920-1930] -0.87 %/yr
[1930-1940] -0.62 %/yr
[1940-1950] -2.36 %/yr
[1950-1960] -0.69 %/yr
[1960-1970] -0.92 %/yr
[1970-1980] -0.35 %/yr
[1980-1990] -0.58 %/yr
[1990-2000] +0.9 %/yr
[2000-2005] -0.22 %/yr
[2005-2010] -0.02 %/yr
[2010-2014] +0.01 %/yr
Looking for settlements in Ottawa County? Visit this page: Settlements in Ottawa County, KS
Population of Ottawa County by age groups male (M) and female (F)[1b]
| Age Gr. | (M) | (F) | Total |
| 0 to 4 | 200 | 156 | 356 |
| 5 to 9 | 223 | 181 | 404 |
| 10 to 14 | 241 | 182 | 423 |
| 15 to 19 | 229 | 199 | 428 |
| 20 to 24 | 177 | 118 | 295 |
| 25 to 29 | 149 | 122 | 271 |
| 30 to 34 | 182 | 162 | 344 |
| 35 to 39 | 185 | 167 | 352 |
| 40 to 44 | 173 | 179 | 352 |
| 45 to 49 | 168 | 174 | 342 |
| 50 to 54 | 250 | 253 | 503 |
| 55 to 59 | 232 | 227 | 459 |
| 60 to 64 | 220 | 224 | 444 |
| 65 to 69 | 157 | 146 | 303 |
| 70 to 74 | 120 | 149 | 269 |
| 75 to 79 | 115 | 110 | 225 |
| 80 to 84 | 84 | 83 | 167 |
| 85+ | 54 | 74 | 128 |
Ottawa County resident population estimates by Sex, Race, and Hispanic Origin[1b]. For full list of abbrevations see: population.us/about page.
| Race | Male | Female | Total |
| WAC | 3091 | 2865 | 5,956 |
| NH | 3052 | 2827 | 5,879 |
| WA | 3043 | 2830 | 5,873 |
| NHWAC | 2992 | 2790 | 5,782 |
| NHWA | 2952 | 2758 | 5,710 |
| H | 107 | 79 | 186 |
| HWAC | 99 | 75 | 174 |
| HWA | 91 | 72 | 163 |
| TOM | 54 | 37 | 91 |
| BAC | 60 | 29 | 89 |
| NHBAC | 54 | 28 | 82 |
| IAC | 45 | 32 | 77 |
| NHTOM | 43 | 34 | 77 |
| NHIAC | 32 | 27 | 59 |
| NHBA | 39 | 16 | 55 |
| BA | 39 | 16 | 55 |
| AAC | 16 | 17 | 33 |
| IA | 18 | 14 | 32 |
| NHAAC | 15 | 16 | 31 |
| NHIA | 13 | 10 | 23 |
| HIAC | 13 | 5 | 18 |
| HTOM | 11 | 3 | 14 |
| AA | 5 | 9 | 14 |
| NHAA | 5 | 9 | 14 |
| HIA | 5 | 4 | 9 |
| HBAC | 6 | 1 | 7 |
| NAC | 4 | 1 | 5 |
| NHNAC | 4 | 1 | 5 |
| HAAC | 1 | 1 | 2 |
| HNAC | 0 | 0 | 0 |
| NHNA | 0 | 0 | 0 |
| NA | 0 | 0 | 0 |
| HBA | 0 | 0 | 0 |
| HAA | 0 | 0 | 0 |
| HNA | 0 | 0 | 0 |
• Riley County population
50.8 mi,  77°
77°
• Saline County
24.3 mi,  179°
179°
• Geary County
48.5 mi,  101°
101°
• Dickinson County
32.6 mi,  124°
124°
• Cloud County
24.1 mi,  1°
1°
• Clay County
29.7 mi,  61°
61°
• Ellsworth County
42.3 mi,  224°
224°
• Mitchell County
34.4 mi,  300°
300°
• Republic County
47.7 mi, 0°
• Lincoln County
30.6 mi,  258°
258°
[0] Calculated by population.us from last known population growth rate, not official data.
[1] County population - 2014, archived from the original, retrieved 02/23/2016
[1b] Annual County Resident Population Estimates by Age, Sex, Race, and Hispanic Origin, (used only data for 2014) archived from the original, retrieved 02/23/2016
[2] County population - 2000-2010, archived from the original, retrieved 02/23/2016
[3] Population of States and Counties of the United States: 1790 to 1992, PDF, 15 Mb, census.gov, retrieved 02/23/2016
[4] County area, latitude longitude data, retrieved 02/23/2016
[5] County boundaries, CSV files on boundaries.us, retrived 03/18/2016
Page generated in 0.017 seconds© 2016 population.us | Terms of use | Contact