Last official estimated population of Fremont County was 7,421 (year 2014)[1]. This was 0.002% of total US population and 0.2% of total Iowa state population. Area of Fremont County is 516.6 mi² (=1338.1 km²), in this year population density was 14.36 p/mi². If population growth rate would be same as in period 2010-2014 (-0.07%/yr), Fremont County population in 2026 would be 7,361 [0].
Historical population of Fremont County for period 1850-2014 [1] , [2] , [3]:
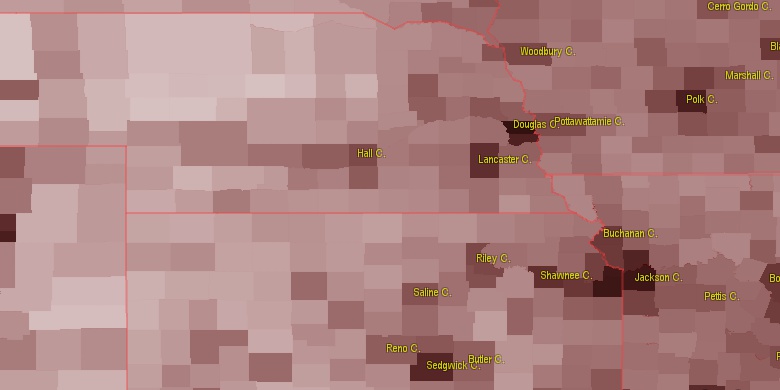
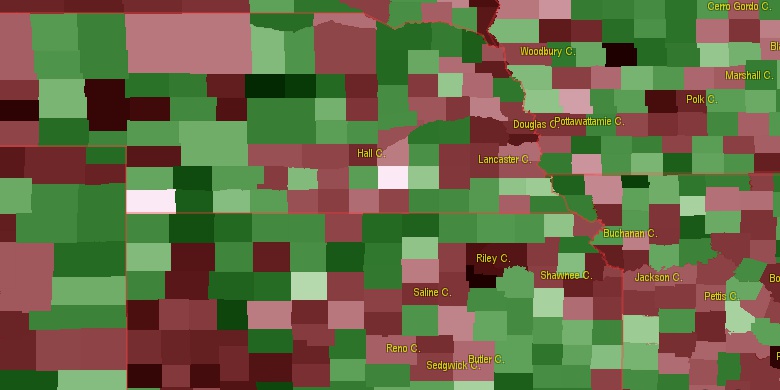
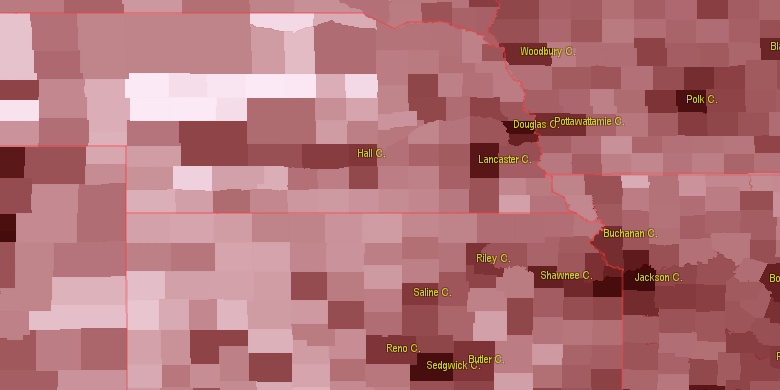
Estimated population for 2014[1]. Population density is in p./sq.mi [4]. Changes are for period 2010-2015. Value is %/year. Boundary lines are approx. 2012 [5]. Click on flag to hide it.
Population • Density • Changes • Legends • Position

[1850-1860] +15.09 %/yr
[1860-1870] +8.21 %/yr
[1870-1880] +4.68 %/yr
[1880-1890] -0.47 %/yr
[1890-1900] +0.97 %/yr
[1900-1910] -1.7 %/yr
[1910-1920] -0.11 %/yr
[1920-1930] +0.06 %/yr
[1930-1940] -0.59 %/yr
[1940-1950] -1.71 %/yr
[1950-1960] -1.79 %/yr
[1960-1970] -1.02 %/yr
[1970-1980] +0.13 %/yr
[1980-1990] -1.33 %/yr
[1990-2000] -0.27 %/yr
[2000-2005] -1 %/yr
[2005-2010] -0.46 %/yr
[2010-2014] -0.07 %/yr
Looking for settlements in Fremont County? Visit this page: Settlements in Fremont County, IA
Population of Fremont County by age groups male (M) and female (F)[1b]
| Age Gr. | (M) | (F) | Total |
| 0 to 4 | 180 | 196 | 376 |
| 5 to 9 | 218 | 222 | 440 |
| 10 to 14 | 237 | 216 | 453 |
| 15 to 19 | 217 | 202 | 419 |
| 20 to 24 | 156 | 138 | 294 |
| 25 to 29 | 178 | 148 | 326 |
| 30 to 34 | 168 | 176 | 344 |
| 35 to 39 | 201 | 180 | 381 |
| 40 to 44 | 190 | 200 | 390 |
| 45 to 49 | 191 | 196 | 387 |
| 50 to 54 | 265 | 269 | 534 |
| 55 to 59 | 320 | 305 | 625 |
| 60 to 64 | 272 | 262 | 534 |
| 65 to 69 | 231 | 241 | 472 |
| 70 to 74 | 147 | 166 | 313 |
| 75 to 79 | 114 | 141 | 255 |
| 80 to 84 | 99 | 123 | 222 |
| 85+ | 86 | 171 | 257 |
Fremont County resident population estimates by Sex, Race, and Hispanic Origin[1b]. For full list of abbrevations see: population.us/about page.
| Race | Male | Female | Total |
| WAC | 3415 | 3511 | 6,926 |
| WA | 3371 | 3479 | 6,850 |
| NH | 3385 | 3456 | 6,841 |
| NHWAC | 3335 | 3421 | 6,756 |
| NHWA | 3304 | 3390 | 6,694 |
| H | 85 | 96 | 181 |
| HWAC | 80 | 90 | 170 |
| HWA | 67 | 89 | 156 |
| BAC | 47 | 33 | 80 |
| TOM | 45 | 35 | 80 |
| NHBAC | 40 | 30 | 70 |
| NHTOM | 32 | 34 | 66 |
| IAC | 34 | 24 | 58 |
| BA | 32 | 18 | 50 |
| NHIAC | 25 | 23 | 48 |
| NHBA | 28 | 15 | 43 |
| AAC | 21 | 13 | 34 |
| NHAAC | 18 | 10 | 28 |
| AA | 14 | 9 | 23 |
| NHAA | 13 | 6 | 19 |
| IA | 8 | 8 | 16 |
| NHIA | 8 | 8 | 16 |
| HTOM | 13 | 1 | 14 |
| HIAC | 9 | 1 | 10 |
| HBAC | 7 | 3 | 10 |
| HBA | 4 | 3 | 7 |
| NAC | 1 | 6 | 7 |
| NHNAC | 1 | 6 | 7 |
| HAAC | 3 | 3 | 6 |
| HAA | 1 | 3 | 4 |
| NA | 0 | 3 | 3 |
| NHNA | 0 | 3 | 3 |
| HNAC | 0 | 0 | 0 |
| HNA | 0 | 0 | 0 |
| HIA | 0 | 0 | 0 |
• Sarpy County population
37 mi,  314°
314°
• Pottawattamie County
41.4 mi,  3°
3°
• Cass County
30.6 mi,  292°
292°
• Page County
23.8 mi,  90°
90°
• Otoe County
28.8 mi,  255°
255°
• Mills County
20.1 mi,  357°
357°
• Montgomery County
30.1 mi,  50°
50°
• Nemaha County
28.1 mi,  208°
208°
• Atchison County
23.1 mi,  158°
158°
• Johnson County
42.4 mi,  235°
235°
[0] Calculated by population.us from last known population growth rate, not official data.
[1] County population - 2014, archived from the original, retrieved 02/23/2016
[1b] Annual County Resident Population Estimates by Age, Sex, Race, and Hispanic Origin, (used only data for 2014) archived from the original, retrieved 02/23/2016
[2] County population - 2000-2010, archived from the original, retrieved 02/23/2016
[3] Population of States and Counties of the United States: 1790 to 1992, PDF, 15 Mb, census.gov, retrieved 02/23/2016
[4] County area, latitude longitude data, retrieved 02/23/2016
[5] County boundaries, CSV files on boundaries.us, retrived 03/18/2016
Page generated in 0.016 seconds© 2016 population.us | Terms of use | Contact