Last official estimated population of Lee County was 28,431 (year 2014)[1]. This was 0.009% of total US population and 0.3% of total Georgia state population. Area of Lee County is 361.8 mi² (=937 km²), in this year population density was 78.58 p/mi². If population growth rate would be same as in period 2010-2014 (+0.12%/yr), Lee County population in 2026 would be 28,834 [0].
Historical population of Lee County for period 1830-2014 [1] , [2] , [3]:
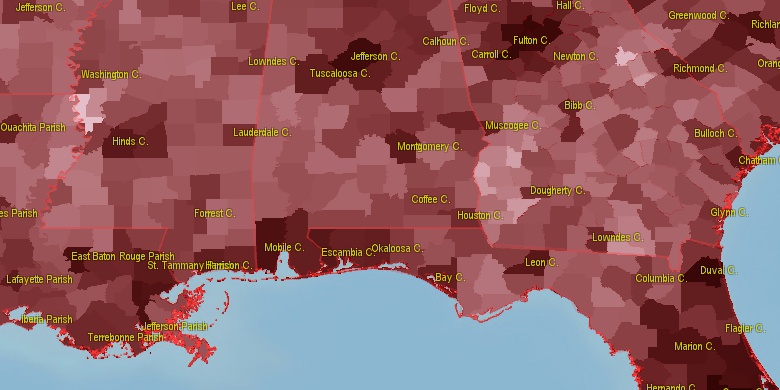
Estimated population for 2014[1]. Population density is in p./sq.mi [4]. Changes are for period 2010-2015. Value is %/year. Boundary lines are approx. 2012 [5]. Click on flag to hide it.
Population • Density • Changes • Legends • Position

[1830-1840] +10.4 %/yr
[1840-1850] +3.95 %/yr
[1850-1860] +0.78 %/yr
[1860-1870] +2.89 %/yr
[1870-1880] +1.01 %/yr
[1880-1890] -1.52 %/yr
[1890-1900] +1.32 %/yr
[1900-1910] +1.22 %/yr
[1910-1920] -0.68 %/yr
[1920-1930] -2.66 %/yr
[1930-1940] -0.61 %/yr
[1940-1950] -1.59 %/yr
[1950-1960] -0.73 %/yr
[1960-1970] +1.28 %/yr
[1970-1980] +5.19 %/yr
[1980-1990] +3.35 %/yr
[1990-2000] +4.3 %/yr
[2000-2005] +1.37 %/yr
[2005-2010] +1.32 %/yr
[2010-2014] +0.12 %/yr
Looking for settlements in Lee County? Visit this page: Settlements in Lee County, GA
Population of Lee County by age groups male (M) and female (F)[1b]
| Age Gr. | (M) | (F) | Total |
| 0 to 4 | 952 | 911 | 1,863 |
| 5 to 9 | 1121 | 1072 | 2,193 |
| 10 to 14 | 1211 | 1119 | 2,330 |
| 15 to 19 | 1119 | 1034 | 2,153 |
| 20 to 24 | 877 | 848 | 1,725 |
| 25 to 29 | 865 | 837 | 1,702 |
| 30 to 34 | 998 | 1041 | 2,039 |
| 35 to 39 | 1038 | 997 | 2,035 |
| 40 to 44 | 1196 | 1163 | 2,359 |
| 45 to 49 | 1072 | 1008 | 2,080 |
| 50 to 54 | 950 | 1035 | 1,985 |
| 55 to 59 | 1002 | 979 | 1,981 |
| 60 to 64 | 797 | 816 | 1,613 |
| 65 to 69 | 686 | 655 | 1,341 |
| 70 to 74 | 368 | 385 | 753 |
| 75 to 79 | 225 | 276 | 501 |
| 80 to 84 | 114 | 168 | 282 |
| 85+ | 64 | 192 | 256 |
Lee County resident population estimates by Sex, Race, and Hispanic Origin[1b]. For full list of abbrevations see: population.us/about page.
| Race | Male | Female | Total |
| NH | 14250 | 14182 | 28,432 |
| WAC | 11076 | 11186 | 22,262 |
| WA | 10922 | 10993 | 21,915 |
| NHWAC | 10723 | 10885 | 21,608 |
| NHWA | 10587 | 10704 | 21,291 |
| BAC | 3241 | 3031 | 6,272 |
| NHBAC | 3199 | 2990 | 6,189 |
| BA | 3148 | 2905 | 6,053 |
| NHBA | 3116 | 2872 | 5,988 |
| AAC | 391 | 417 | 808 |
| NHAAC | 377 | 405 | 782 |
| H | 405 | 354 | 759 |
| AA | 333 | 354 | 687 |
| NHAA | 324 | 345 | 669 |
| HWAC | 353 | 301 | 654 |
| HWA | 335 | 289 | 624 |
| TOM | 184 | 219 | 403 |
| NHTOM | 163 | 205 | 368 |
| IAC | 117 | 111 | 228 |
| NHIAC | 98 | 97 | 195 |
| IA | 53 | 51 | 104 |
| NHIA | 45 | 42 | 87 |
| HBAC | 42 | 41 | 83 |
| HBA | 32 | 33 | 65 |
| NAC | 26 | 30 | 56 |
| NHNAC | 24 | 28 | 52 |
| HTOM | 21 | 14 | 35 |
| HIAC | 19 | 14 | 33 |
| NHNA | 15 | 14 | 29 |
| NA | 15 | 14 | 29 |
| HAAC | 14 | 12 | 26 |
| HAA | 9 | 9 | 18 |
| HIA | 8 | 9 | 17 |
| HNAC | 2 | 2 | 4 |
| HNA | 0 | 0 | 0 |
• Dougherty County population
20.1 mi,  190°
190°
• Sumter County
15.8 mi,  347°
347°
• Crisp County
24 mi,  73°
73°
• Worth County
25.4 mi,  136°
136°
• Dooly County
30.4 mi,  40°
40°
• Terrell County
17.4 mi,  260°
260°
• Turner County
31.6 mi,  101°
101°
• Calhoun County
34.9 mi,  233°
233°
• Schley County
32.4 mi,  341°
341°
• Webster County
28.6 mi,  303°
303°
[0] Calculated by population.us from last known population growth rate, not official data.
[1] County population - 2014, archived from the original, retrieved 02/23/2016
[1b] Annual County Resident Population Estimates by Age, Sex, Race, and Hispanic Origin, (used only data for 2014) archived from the original, retrieved 02/23/2016
[2] County population - 2000-2010, archived from the original, retrieved 02/23/2016
[3] Population of States and Counties of the United States: 1790 to 1992, PDF, 15 Mb, census.gov, retrieved 02/23/2016
[4] County area, latitude longitude data, retrieved 02/23/2016
[5] County boundaries, CSV files on boundaries.us, retrived 03/18/2016
Page generated in 0.01 seconds© 2016 population.us | Terms of use | Contact


