Last official estimated population of Butler County was 20,945 (year 2014)[1]. This was 0.007% of total US population and 0.4% of total Alabama state population. Area of Butler County is 777.9 mi² (=2014.7 km²), in this year population density was 26.93 p/mi². If population growth rate would be same as in period 2010-2014 (-0%/yr), Butler County population in 2026 would be 20,939 [0].
Historical population of Butler County for period 1820-2014 [1] , [2] , [3]:
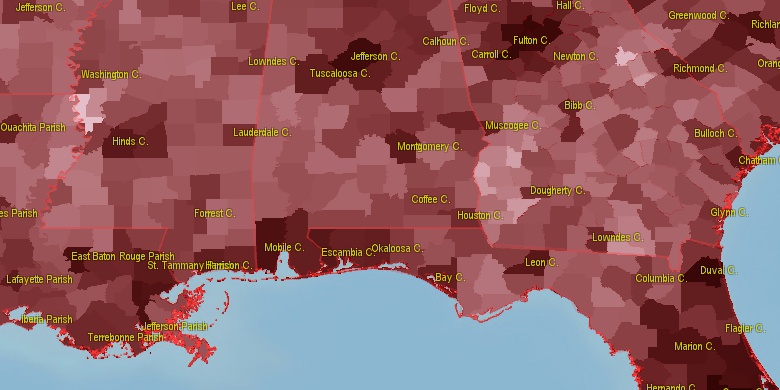
Estimated population for 2014[1]. Population density is in p./sq.mi [4]. Changes are for period 2010-2015. Value is %/year. Boundary lines are approx. 2012 [5]. Click on flag to hide it.
Population • Density • Changes • Legends • Position

[1820-1830] +14.93 %/yr
[1830-1840] +4.39 %/yr
[1840-1850] +2.24 %/yr
[1850-1860] +5.28 %/yr
[1860-1870] -1.89 %/yr
[1870-1880] +2.75 %/yr
[1880-1890] +0.97 %/yr
[1890-1900] +1.76 %/yr
[1900-1910] +1.2 %/yr
[1910-1920] +0.17 %/yr
[1920-1930] +0.22 %/yr
[1930-1940] +0.72 %/yr
[1940-1950] -1.04 %/yr
[1950-1960] -1.73 %/yr
[1960-1970] -1.09 %/yr
[1970-1980] -0.15 %/yr
[1980-1990] +0.1 %/yr
[1990-2000] -0.23 %/yr
[2000-2005] -0.53 %/yr
[2005-2010] +0.11 %/yr
[2010-2014] -0 %/yr
Looking for settlements in Butler County? Visit this page: Settlements in Butler County, AL
Population of Butler County by age groups male (M) and female (F)[1b]
| Age Gr. | (M) | (F) | Total |
| 0 to 4 | 621 | 609 | 1,230 |
| 5 to 9 | 709 | 648 | 1,357 |
| 10 to 14 | 739 | 638 | 1,377 |
| 15 to 19 | 634 | 626 | 1,260 |
| 20 to 24 | 598 | 599 | 1,197 |
| 25 to 29 | 506 | 664 | 1,170 |
| 30 to 34 | 570 | 689 | 1,259 |
| 35 to 39 | 540 | 664 | 1,204 |
| 40 to 44 | 536 | 622 | 1,158 |
| 45 to 49 | 486 | 618 | 1,104 |
| 50 to 54 | 615 | 803 | 1,418 |
| 55 to 59 | 736 | 764 | 1,500 |
| 60 to 64 | 637 | 781 | 1,418 |
| 65 to 69 | 565 | 569 | 1,134 |
| 70 to 74 | 352 | 451 | 803 |
| 75 to 79 | 270 | 403 | 673 |
| 80 to 84 | 167 | 326 | 493 |
| 85+ | 140 | 401 | 541 |
Butler County resident population estimates by Sex, Race, and Hispanic Origin[1b]. For full list of abbrevations see: population.us/about page.
| Race | Male | Female | Total |
| NH | 9287 | 10766 | 20,053 |
| WAC | 5271 | 5798 | 11,069 |
| WA | 5199 | 5734 | 10,933 |
| NHWAC | 5184 | 5720 | 10,904 |
| NHWA | 5118 | 5659 | 10,777 |
| BAC | 4042 | 4974 | 9,016 |
| NHBAC | 4001 | 4946 | 8,947 |
| BA | 4008 | 4926 | 8,934 |
| NHBA | 3969 | 4899 | 8,868 |
| H | 134 | 109 | 243 |
| AAC | 107 | 112 | 219 |
| NHAAC | 101 | 108 | 209 |
| AA | 93 | 99 | 192 |
| NHAA | 88 | 97 | 185 |
| HWAC | 87 | 78 | 165 |
| HWA | 81 | 75 | 156 |
| TOM | 76 | 77 | 153 |
| NHTOM | 70 | 74 | 144 |
| IAC | 71 | 64 | 135 |
| NHIAC | 66 | 61 | 127 |
| IA | 40 | 35 | 75 |
| NHIA | 38 | 33 | 71 |
| HBAC | 41 | 28 | 69 |
| HBA | 39 | 27 | 66 |
| NAC | 8 | 9 | 17 |
| NHNAC | 6 | 8 | 14 |
| HAAC | 6 | 4 | 10 |
| HTOM | 6 | 3 | 9 |
| NA | 5 | 4 | 9 |
| HIAC | 5 | 3 | 8 |
| NHNA | 4 | 4 | 8 |
| HAA | 5 | 2 | 7 |
| HIA | 2 | 2 | 4 |
| HNAC | 2 | 1 | 3 |
| HNA | 1 | 0 | 1 |
• Montgomery County population
41.9 mi,  41°
41°
• Coffee County
47.4 mi,  120°
120°
• Dallas County
47.5 mi,  327°
327°
• Covington County
37.7 mi,  158°
158°
• Pike County
43.6 mi,  85°
85°
• Monroe County
42.9 mi,  253°
253°
• Crenshaw County
21.4 mi, 93°
• Conecuh County
28.6 mi,  219°
219°
• Wilcox County
40.1 mi,  294°
294°
• Lowndes County
27.4 mi,  3°
3°
[0] Calculated by population.us from last known population growth rate, not official data.
[1] County population - 2014, archived from the original, retrieved 02/23/2016
[1b] Annual County Resident Population Estimates by Age, Sex, Race, and Hispanic Origin, (used only data for 2014) archived from the original, retrieved 02/23/2016
[2] County population - 2000-2010, archived from the original, retrieved 02/23/2016
[3] Population of States and Counties of the United States: 1790 to 1992, PDF, 15 Mb, census.gov, retrieved 02/23/2016
[4] County area, latitude longitude data, retrieved 02/23/2016
[5] County boundaries, CSV files on boundaries.us, retrived 03/18/2016
Page generated in 0.012 seconds© 2016 population.us | Terms of use | Contact


