Last official estimated population of Autauga County was 54,684 (year 2014)[1]. This was 0.017% of total US population and 1.1% of total Alabama state population. Area of Autauga County is 604.4 mi² (=1565.4 km²), in this year population density was 90.48 p/mi². If population growth rate would be same as in period 2010-2014 (+0.05%/yr), Autauga County population in 2026 would be 55,024 [0].
Historical population of Autauga County for period 1820-2014 [1] , [2] , [3]:
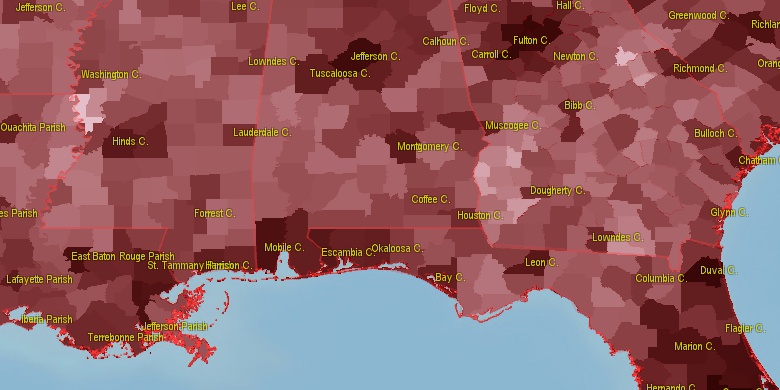
Estimated population for 2014[1]. Population density is in p./sq.mi [4]. Changes are for period 2010-2015. Value is %/year. Boundary lines are approx. 2012 [5]. Click on flag to hide it.
Population • Density • Changes • Legends • Position

[1820-1830] +11.91 %/yr
[1830-1840] +1.91 %/yr
[1840-1850] +0.46 %/yr
[1850-1860] +1.09 %/yr
[1860-1870] -3.58 %/yr
[1870-1880] +1.21 %/yr
[1880-1890] +0.17 %/yr
[1890-1900] +3 %/yr
[1900-1910] +1.13 %/yr
[1910-1920] -0.58 %/yr
[1920-1930] +0.41 %/yr
[1930-1940] +0.63 %/yr
[1940-1950] -1.42 %/yr
[1950-1960] +0.3 %/yr
[1960-1970] +2.7 %/yr
[1970-1980] +2.81 %/yr
[1980-1990] +0.59 %/yr
[1990-2000] +2.49 %/yr
[2000-2005] +2.57 %/yr
[2005-2010] +1.9 %/yr
[2010-2014] +0.05 %/yr
Looking for settlements in Autauga County? Visit this page: Settlements in Autauga County, AL
Population of Autauga County by age groups male (M) and female (F)[1b]
| Age Gr. | (M) | (F) | Total |
| 0 to 4 | 1696 | 1629 | 3,325 |
| 5 to 9 | 1936 | 1853 | 3,789 |
| 10 to 14 | 2105 | 2126 | 4,231 |
| 15 to 19 | 2067 | 1874 | 3,941 |
| 20 to 24 | 1836 | 1796 | 3,632 |
| 25 to 29 | 1677 | 1699 | 3,376 |
| 30 to 34 | 1646 | 1732 | 3,378 |
| 35 to 39 | 1657 | 1857 | 3,514 |
| 40 to 44 | 1993 | 2122 | 4,115 |
| 45 to 49 | 1902 | 2021 | 3,923 |
| 50 to 54 | 2050 | 2080 | 4,130 |
| 55 to 59 | 1649 | 1875 | 3,524 |
| 60 to 64 | 1406 | 1450 | 2,856 |
| 65 to 69 | 1140 | 1376 | 2,516 |
| 70 to 74 | 895 | 1153 | 2,048 |
| 75 to 79 | 648 | 835 | 1,483 |
| 80 to 84 | 410 | 558 | 968 |
| 85+ | 230 | 416 | 646 |
Autauga County resident population estimates by Sex, Race, and Hispanic Origin[1b]. For full list of abbrevations see: population.us/about page.
| Race | Male | Female | Total |
| NH | 26161 | 27720 | 53,881 |
| WAC | 21614 | 22414 | 44,028 |
| WA | 21134 | 22004 | 43,138 |
| NHWAC | 20935 | 21766 | 42,701 |
| NHWA | 20494 | 21383 | 41,877 |
| BAC | 5142 | 5695 | 10,837 |
| NHBAC | 5062 | 5630 | 10,692 |
| BA | 4903 | 5445 | 10,348 |
| NHBA | 4843 | 5402 | 10,245 |
| H | 782 | 732 | 1,514 |
| HWAC | 679 | 648 | 1,327 |
| HWA | 640 | 621 | 1,261 |
| TOM | 512 | 463 | 975 |
| NHTOM | 464 | 428 | 892 |
| AAC | 380 | 484 | 864 |
| NHAAC | 362 | 469 | 831 |
| IAC | 293 | 315 | 608 |
| AA | 235 | 368 | 603 |
| NHAA | 232 | 360 | 592 |
| NHIAC | 251 | 276 | 527 |
| IA | 121 | 154 | 275 |
| NHIA | 104 | 134 | 238 |
| HBAC | 80 | 65 | 145 |
| HBA | 60 | 43 | 103 |
| NAC | 56 | 42 | 98 |
| HTOM | 48 | 35 | 83 |
| HIAC | 42 | 39 | 81 |
| NHNAC | 37 | 32 | 69 |
| NA | 38 | 18 | 56 |
| NHNA | 24 | 13 | 37 |
| HIA | 17 | 20 | 37 |
| HAAC | 18 | 15 | 33 |
| HNAC | 19 | 10 | 29 |
| HNA | 14 | 5 | 19 |
| HAA | 3 | 8 | 11 |
• Montgomery County population
34.4 mi,  131°
131°
• Shelby County
50.5 mi,  357°
357°
• Elmore County
29.7 mi,  81°
81°
• Dallas County
30.5 mi,  243°
243°
• Chilton County
22.7 mi,  348°
348°
• Bibb County
43.5 mi,  320°
320°
• Coosa County
36.2 mi,  40°
40°
• Wilcox County
53.7 mi,  225°
225°
• Lowndes County
26.6 mi,  180°
180°
• Perry County
38.4 mi,  281°
281°
[0] Calculated by population.us from last known population growth rate, not official data.
[1] County population - 2014, archived from the original, retrieved 02/23/2016
[1b] Annual County Resident Population Estimates by Age, Sex, Race, and Hispanic Origin, (used only data for 2014) archived from the original, retrieved 02/23/2016
[2] County population - 2000-2010, archived from the original, retrieved 02/23/2016
[3] Population of States and Counties of the United States: 1790 to 1992, PDF, 15 Mb, census.gov, retrieved 02/23/2016
[4] County area, latitude longitude data, retrieved 02/23/2016
[5] County boundaries, CSV files on boundaries.us, retrived 03/18/2016
Page generated in 0.006 seconds© 2016 population.us | Terms of use | Contact


