Last official estimated population of Cowlington town (Le Flore County**, Oklahoma state) was 151 (year 2014)[1]. This was 0% of total US population and 0% of total Oklahoma state population. Area of Cowlington town is 0.9 mi² (=2.5 km²)[6], in this year population density was 159.11 p/mi². If population growth rate would be same as in period 2010-2014 (-0.65%/yr), Cowlington town population in 2026 would be 140*.
Historical population of Cowlington town for period 1900-2014:
Estimated population for 2014[1]. Click on flag to hide it.
Population • Legends • Position

[1900-1910] +3.35 %/yr
[1910-1920] -0.94 %/yr
[1920-1930] -2.58 %/yr
[1930-1940] -1.67 %/yr
[1940-1950] -9.45 %/yr
[1950-1960] -1.14 %/yr
[1960-1970] +26.08 %/yr
[1970-1980] -3.14 %/yr
[1980-1990] -12.24 %/yr
[1990-2000] -1.06 %/yr
[2000-2005] +1.46 %/yr
[2005-2010] +1.62 %/yr
[2010-2014] -0.65 %/yr
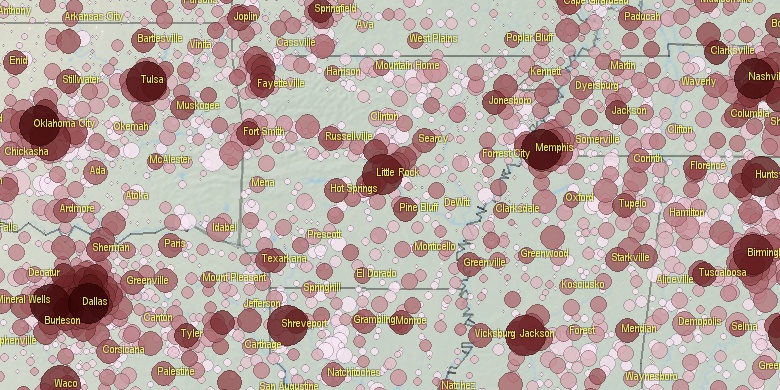
• Sallisaw city population
10.5 mi,  353°
353°
• Muldrow town
12.3 mi,  58°
58°
• Spiro town
10.3 mi,  117°
117°
• Panama town
11.5 mi,  146°
146°
• Shady Point town
14.2 mi, 152°
• Keota town
8.6 mi,  245°
245°
• Bokoshe town
8.2 mi,  182°
182°
• Fort Coffee town
12 mi,  95°
95°
• Gans town
7.4 mi,  42°
42°
• Tamaha town
14.3 mi,  295°
295°
*Calculated by population.us from last known population growth rate, not official data.
**Some cities are placed on more than one county. Only 1 county is shown.
[1] Cities and Towns (Incorporated Places and Minor Civil Divisions) 2014, archived from the original, retrieved 02/23/2016
[2] City and Town Intercensal Estimates (2000-2010), archived from the original, retrieved 02/23/2016
[3] Places: 1990 and 1999 Populations, With Numeric and Percent Population Change, archived from the original, retrieved 02/23/2016
[4] Population of the 100 Largest Urban Places: 1980,
[5] Population of the 100 Largest Urban Places in history,
[6] Area, latitude longitude data, retrieved 02/23/2016
[7] Through the Decades, Overview 1790-2010, PDF, large files! >100 Mb
Page generated in 0.038 seconds© 2016 population.us | Terms of use | Contact

