Last official estimated population of Abbeville County was 25,345 (year 2014)[1]. This was 0.008% of total US population and 0.5% of total South Carolina state population. Area of Abbeville County is 511.0 mi² (=1323.5 km²), in this year population density was 49.60 p/mi². If population growth rate would be same as in period 2010-2014 (-0.07%/yr), Abbeville County population in 2024 would be 25,166 [0].
Historical population of Abbeville County for period 1790-2014 [1] , [2] , [3]:
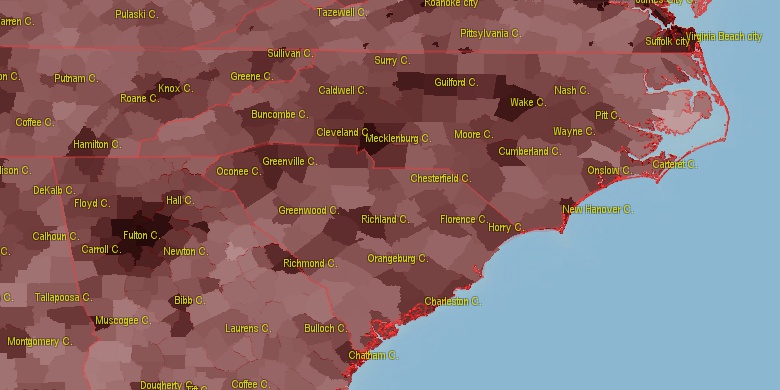
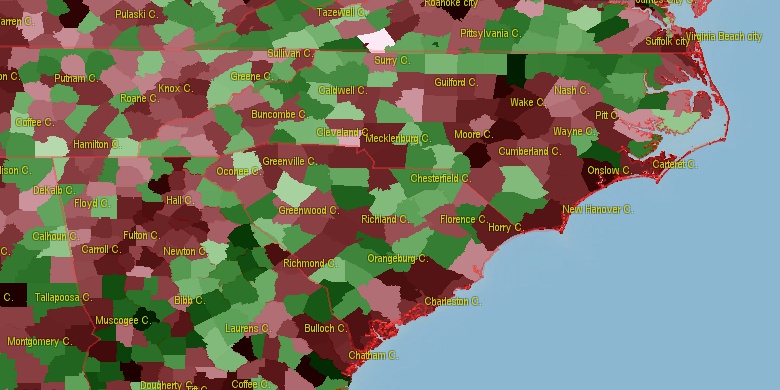
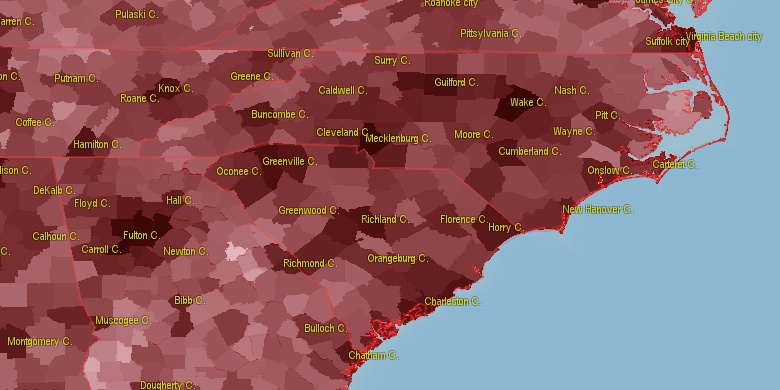
Estimated population for 2014[1]. Population density is in p./sq.mi [4]. Changes are for period 2010-2015. Value is %/year. Boundary lines are approx. 2012 [5]. Click on flag to hide it.
Population • Density • Changes • Legends • Position

[1790-1800] +3.95 %/yr
[1800-1810] +4.55 %/yr
[1810-1820] +0.91 %/yr
[1820-1830] +1.97 %/yr
[1830-1840] +0.42 %/yr
[1840-1850] +0.97 %/yr
[1850-1860] +0.02 %/yr
[1860-1870] -0.39 %/yr
[1870-1880] +2.75 %/yr
[1880-1890] +1.39 %/yr
[1890-1900] -3.33 %/yr
[1900-1910] +0.41 %/yr
[1910-1920] -2.46 %/yr
[1920-1930] -1.5 %/yr
[1930-1940] -0.17 %/yr
[1940-1950] -0.21 %/yr
[1950-1960] -0.47 %/yr
[1960-1970] -0.14 %/yr
[1970-1980] +0.7 %/yr
[1980-1990] +0.53 %/yr
[1990-2000] +0.92 %/yr
[2000-2005] -0.12 %/yr
[2005-2010] -0.45 %/yr
[2010-2014] -0.07 %/yr
Looking for settlements in Abbeville County? Visit this page: Settlements in Abbeville County, SC
Population of Abbeville County by age groups male (M) and female (F)[1b]
| Age Gr. | (M) | (F) | Total |
| 0 to 4 | 685 | 673 | 1,358 |
| 5 to 9 | 790 | 693 | 1,483 |
| 10 to 14 | 799 | 757 | 1,556 |
| 15 to 19 | 880 | 830 | 1,710 |
| 20 to 24 | 841 | 875 | 1,716 |
| 25 to 29 | 615 | 607 | 1,222 |
| 30 to 34 | 619 | 649 | 1,268 |
| 35 to 39 | 613 | 672 | 1,285 |
| 40 to 44 | 746 | 771 | 1,517 |
| 45 to 49 | 778 | 833 | 1,611 |
| 50 to 54 | 810 | 903 | 1,713 |
| 55 to 59 | 895 | 959 | 1,854 |
| 60 to 64 | 875 | 964 | 1,839 |
| 65 to 69 | 824 | 869 | 1,693 |
| 70 to 74 | 543 | 648 | 1,191 |
| 75 to 79 | 383 | 481 | 864 |
| 80 to 84 | 214 | 352 | 566 |
| 85+ | 193 | 326 | 519 |
Abbeville County resident population estimates by Sex, Race, and Hispanic Origin[1b]. For full list of abbrevations see: population.us/about page.
| Race | Male | Female | Total |
| NH | 11941 | 12716 | 24,657 |
| WAC | 8698 | 8996 | 17,694 |
| NHWAC | 8565 | 8881 | 17,446 |
| WA | 8561 | 8846 | 17,407 |
| NHWA | 8433 | 8732 | 17,165 |
| BAC | 3417 | 3861 | 7,278 |
| NHBAC | 3389 | 3833 | 7,222 |
| BA | 3322 | 3751 | 7,073 |
| NHBA | 3298 | 3723 | 7,021 |
| TOM | 146 | 166 | 312 |
| H | 162 | 146 | 308 |
| NHTOM | 141 | 165 | 306 |
| HWAC | 133 | 115 | 248 |
| HWA | 128 | 114 | 242 |
| IAC | 74 | 85 | 159 |
| NHIAC | 68 | 84 | 152 |
| AAC | 60 | 79 | 139 |
| NHAAC | 60 | 76 | 136 |
| AA | 39 | 58 | 97 |
| NHAA | 39 | 56 | 95 |
| IA | 33 | 37 | 70 |
| NHIA | 29 | 36 | 65 |
| HBAC | 28 | 28 | 56 |
| HBA | 24 | 28 | 52 |
| NAC | 5 | 10 | 15 |
| NHNAC | 4 | 10 | 14 |
| HIAC | 6 | 1 | 7 |
| HTOM | 5 | 1 | 6 |
| NA | 2 | 4 | 6 |
| HIA | 4 | 1 | 5 |
| NHNA | 1 | 4 | 5 |
| HAAC | 0 | 3 | 3 |
| HAA | 0 | 2 | 2 |
| HNAC | 1 | 0 | 1 |
| HNA | 1 | 0 | 1 |
• Anderson County population
23.5 mi,  334°
334°
• Greenwood County
19.4 mi,  101°
101°
• Laurens County
31.9 mi,  54°
54°
• Edgefield County
41.3 mi,  136°
136°
• Hart County
30.2 mi,  287°
287°
• Elbert County
22.8 mi,  252°
252°
• Oglethorpe County
42.5 mi,  235°
235°
• Wilkes County
34.3 mi,  208°
208°
• McCormick County
23.4 mi,  159°
159°
• Lincoln County
29.1 mi,  178°
178°
[0] Calculated by population.us from last known population growth rate, not official data.
[1] County population - 2014, archived from the original, retrieved 02/23/2016
[1b] Annual County Resident Population Estimates by Age, Sex, Race, and Hispanic Origin, (used only data for 2014) archived from the original, retrieved 02/23/2016
[2] County population - 2000-2010, archived from the original, retrieved 02/23/2016
[3] Population of States and Counties of the United States: 1790 to 1992, PDF, 15 Mb, census.gov, retrieved 02/23/2016
[4] County area, latitude longitude data, retrieved 02/23/2016
[5] County boundaries, CSV files on boundaries.us, retrived 03/18/2016
Page generated in 0.016 seconds© 2016 population.us | Terms of use | Contact