Last official estimated population of Kershaw County was 61,678 (year 2014)[1]. This was 0.019% of total US population and 1.3% of total South Carolina state population. Area of Kershaw County is 740.3 mi² (=1917.5 km²), in this year population density was 83.31 p/mi². If population growth rate would be same as in period 2010-2014 (-0.01%/yr), Kershaw County population in 2024 would be 61,631 [0].
Historical population of Kershaw County for period 1800-2014 [1] , [2] , [3]:
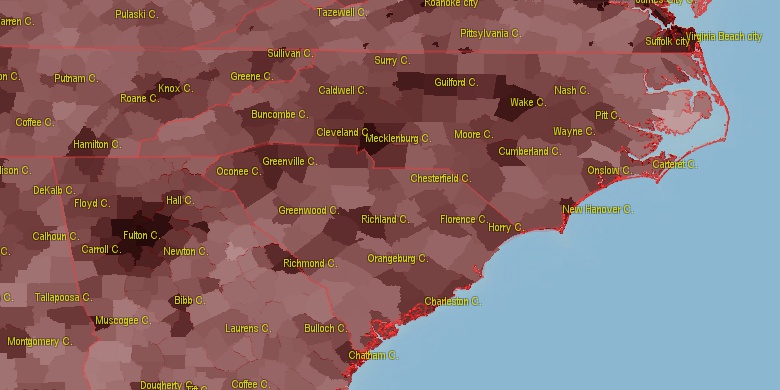
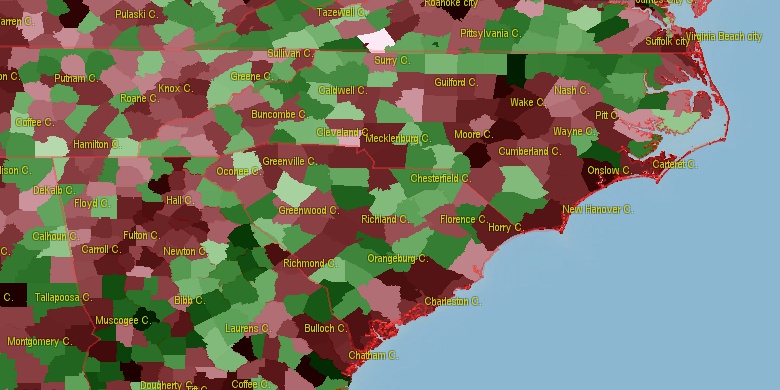
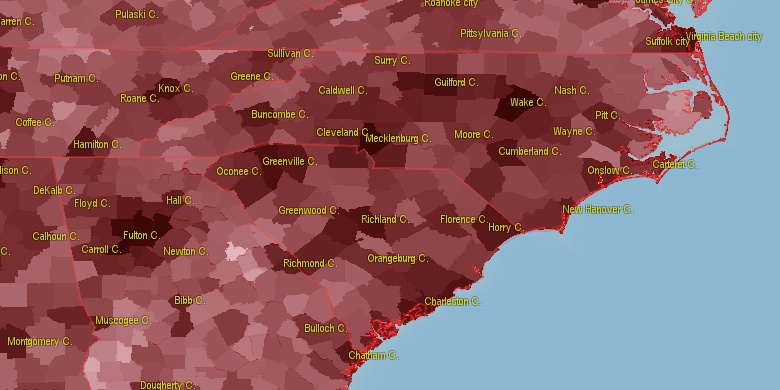
Estimated population for 2014[1]. Population density is in p./sq.mi [4]. Changes are for period 2010-2015. Value is %/year. Boundary lines are approx. 2012 [5]. Click on flag to hide it.
Population • Density • Changes • Legends • Position

[1800-1810] +3 %/yr
[1810-1820] +2.34 %/yr
[1820-1830] +0.86 %/yr
[1830-1840] -0.97 %/yr
[1840-1850] +1.66 %/yr
[1850-1860] -1 %/yr
[1860-1870] -1.07 %/yr
[1870-1880] +6.24 %/yr
[1880-1890] +0.38 %/yr
[1890-1900] +1 %/yr
[1900-1910] +0.93 %/yr
[1910-1920] +0.82 %/yr
[1920-1930] +0.87 %/yr
[1930-1940] +0.26 %/yr
[1940-1950] -0.19 %/yr
[1950-1960] +0.39 %/yr
[1960-1970] +0.33 %/yr
[1970-1980] +1.17 %/yr
[1980-1990] +1.12 %/yr
[1990-2000] +1.9 %/yr
[2000-2005] +1.42 %/yr
[2005-2010] +1.77 %/yr
[2010-2014] -0.01 %/yr
Looking for settlements in Kershaw County? Visit this page: Settlements in Kershaw County, SC
Population of Kershaw County by age groups male (M) and female (F)[1b]
| Age Gr. | (M) | (F) | Total |
| 0 to 4 | 1902 | 1837 | 3,739 |
| 5 to 9 | 2189 | 2050 | 4,239 |
| 10 to 14 | 2200 | 2120 | 4,320 |
| 15 to 19 | 2091 | 1863 | 3,954 |
| 20 to 24 | 1879 | 1765 | 3,644 |
| 25 to 29 | 1729 | 1846 | 3,575 |
| 30 to 34 | 1808 | 1903 | 3,711 |
| 35 to 39 | 1770 | 1921 | 3,691 |
| 40 to 44 | 1905 | 2009 | 3,914 |
| 45 to 49 | 1958 | 2211 | 4,169 |
| 50 to 54 | 2280 | 2484 | 4,764 |
| 55 to 59 | 2311 | 2467 | 4,778 |
| 60 to 64 | 2035 | 2267 | 4,302 |
| 65 to 69 | 1762 | 1896 | 3,658 |
| 70 to 74 | 1220 | 1372 | 2,592 |
| 75 to 79 | 754 | 1011 | 1,765 |
| 80 to 84 | 513 | 749 | 1,262 |
| 85+ | 340 | 744 | 1,084 |
Kershaw County resident population estimates by Sex, Race, and Hispanic Origin[1b]. For full list of abbrevations see: population.us/about page.
| Race | Male | Female | Total |
| NH | 29184 | 31328 | 60,512 |
| WAC | 22832 | 23604 | 46,436 |
| WA | 22412 | 23133 | 45,545 |
| NHWAC | 21608 | 22594 | 44,202 |
| NHWA | 21229 | 22168 | 43,397 |
| BAC | 7730 | 8803 | 16,533 |
| NHBAC | 7538 | 8635 | 16,173 |
| BA | 7442 | 8474 | 15,916 |
| NHBA | 7269 | 8340 | 15,609 |
| H | 1462 | 1187 | 2,649 |
| HWAC | 1224 | 1010 | 2,234 |
| HWA | 1183 | 965 | 2,148 |
| TOM | 466 | 528 | 994 |
| NHTOM | 421 | 474 | 895 |
| AAC | 249 | 342 | 591 |
| NHAAC | 224 | 323 | 547 |
| IAC | 281 | 254 | 535 |
| NHIAC | 219 | 216 | 435 |
| AA | 172 | 255 | 427 |
| NHAA | 156 | 246 | 402 |
| HBAC | 192 | 168 | 360 |
| HBA | 173 | 134 | 307 |
| IA | 131 | 101 | 232 |
| NHIA | 95 | 83 | 178 |
| HIAC | 62 | 38 | 100 |
| HTOM | 45 | 54 | 99 |
| NAC | 40 | 53 | 93 |
| NHNAC | 29 | 43 | 72 |
| HIA | 36 | 18 | 54 |
| NA | 23 | 24 | 47 |
| HAAC | 25 | 19 | 44 |
| NHNA | 14 | 17 | 31 |
| HAA | 16 | 9 | 25 |
| HNAC | 11 | 10 | 21 |
| HNA | 9 | 7 | 16 |
• Richland County population
27.7 mi,  219°
219°
• Union County
45.3 mi,  4°
4°
• Sumter County
31.5 mi,  157°
157°
• Lancaster County
24.9 mi,  345°
345°
• Darlington County
35.9 mi,  90°
90°
• Chesterfield County
32.1 mi,  49°
49°
• Chester County
40.5 mi,  306°
306°
• Fairfield County
30.8 mi,  277°
277°
• Lee County
23 mi,  122°
122°
• Calhoun County
47.1 mi,  193°
193°
[0] Calculated by population.us from last known population growth rate, not official data.
[1] County population - 2014, archived from the original, retrieved 02/23/2016
[1b] Annual County Resident Population Estimates by Age, Sex, Race, and Hispanic Origin, (used only data for 2014) archived from the original, retrieved 02/23/2016
[2] County population - 2000-2010, archived from the original, retrieved 02/23/2016
[3] Population of States and Counties of the United States: 1790 to 1992, PDF, 15 Mb, census.gov, retrieved 02/23/2016
[4] County area, latitude longitude data, retrieved 02/23/2016
[5] County boundaries, CSV files on boundaries.us, retrived 03/18/2016
See note 16 South Carolina Notes
Page generated in 0.049 seconds© 2016 population.us | Terms of use | Contact